
A world inquiring about the origins of SARS-CoV-2 has been met with repeated antipathy and lack of cooperation on the part of the Chinese Communist Party. Consequently, any speculation that the CCP concealed the presence of SARS-CoV-2 prior to December 2019 must be researched through an examination of corroborating yet circumstantial evidence. Inference which may be ascertained only through prosecution along a series of must-answer critical questions.
The Chinese Communist Party owes the entire world restitution for its negligent handling and release of a virus which they fully understood could be deployed as a weapon of war. A virus which has destroyed human rights, worldwide economies, and furthermore resulted in over 5 million deaths globally to date.
Note: Genetic analyses of both Covid-19 and its Omicron variant are contained in Questions #7 a. and b.

When the United States Navy mistakenly shot down a civilian airliner over the Persian Gulf, Iran Flight 655 on July 3rd 1988, despite some reasonable evidence as to its helicopters having coming under fire during that incident, the United States could not have reasonably made the claim ‘Does it really make a difference who is at fault? Let’s focus on making sure there is no repeat of this type of incident’.
Despite most folks understanding that it would not (usually) intentionally shoot down a civilian passenger airliner, the United States in this instance still owed restitution to Iran and its harmed citizens for malicious negligence in the handling and safekeeping of a potential weapon of war – an Aegis/SM-2MR anti-air warfare missile system. The United States had been entrusted by the international community with keeping peace in the Persian Gulf and furthermore maintaining the safety of key shipping lanes therein. The U.S. was negligent and cavalier in that duty however, mistakenly releasing a missile and causing the death of multiple innocents. In February 1996, the U.S. agreed to pay Iran US$131.8 million in settlement to discontinue a case brought by Iran in 1989 against the U.S. in the International Court of Justice (The Hague).1
Ethically, a gain-of-function man-made virus is no different than a missile system or weapon of war. Those who are entrusted by the international community with safekeeping of such weapons of mass destruction must be held accountable for incompetence in their handling and employment, as well as the harm derived thereof.
The mistaken disposition of an IFF (Identify friend or foe) aircraft transponder signal as ‘foe (hostile)’ – is not materially different from the inept execution of bio safety level (BSL) lab procedures – both involve a hazardous ‘lab’ environment entrusted to professionals supposedly trained in their craft and its safekeeping protocols. Negligence here, imparts liability.
This responsibility mandate is the impetus behind obfuscation efforts on the part of Chinese officials regarding the origins of Covid-19 – efforts to block a reasonable process of discovery, which are profiled in this article. The People’s Republic of China and its Chinese Communist Party (hereinafter ‘the CCP’, ‘China’s CCP’, or ‘The Party’) owe the world restitution along the same legal lines as those which presided in the Iran Flight 655 case. Theirs was a case of malicious negligence in the handling of a Chinese-made virus which could be mistakenly released as a defacto weapon of war, no different than a missile inadvertently deployed from an anti-air warfare, or even strategic nuclear system. A duty which was entrusted to them by the international community for handling and safekeeping of such a potential weapon. A duty they were negligent and cavalier in executing, causing the ‘shoot-down’ death of myriad innocents outside their nation.2
How do we infer that the Chinese Communist Party both reacted to and concealed the existence of SARS-CoV-2 as far back as March 2018? There is a critical path of query and dependency necessary and sufficient in prosecuting this problem from a deductive perspective. The questions which compose this pathway are exhibited in detail within this article. To summarize in advance, the critical arguments within this article involve nine key avenues of consilient inference:
- The mismatch in timing of Chinese SARS-CoV-2 B.1 and B.1.617.2 variant global rates of spread
- The conclusive evidence of both risk and culpability that SARS-CoV-2 was released (not zoonotic) from a Chinese BSL gain-of-function lab (during a U.S. ‘pause’ in such research)
- The elevated rates of unidentified ‘flu’ and ‘anosmia’ queries in longitude E65-180 nations during 2018/19, matching geographic pathogenic history
- The observed natural progression of a 47 to 1 Covid prior immunity signal, in longitude E65-180 and across 173 nations (which presided up until Delta variant natural-immunity breakthrough infections)
- The genetics and mutation history of SARS-CoV-2 itself, which strongly suggest an inception case date in early 2018 – from a mouse environment, not wild animal
- The 2021 appearance of a pre-October-2019 genetic Jan-2018-LCA highly divergent variant of SARS-CoV-2 (Omicron) in highly immune African populations under low mutagenic pressure
- The CCP’s social response to an unknown, which resulted in 45-year unprecedented CO2 ppm reductions during 2018/19
- The CCP’s reactive social disruption patterns exhibited during 2019
- The CCP’s Nelsonian knowledge of SARS-CoV-2 exhibited in December 2019, along with its concerted efforts to conceal critical information, databases, 8 index-genomes, 174 index and inception case patient samples/profiles, and pertinent lab production logs.
What follows within this article therefore, and through confirmation of some of its central tenets on the part of U.S. Intelligence services (see Question #17 near end of article), does not constitute a conspiracy theory. Its construct follows:
In the January to March timeframe of 2018, the People’s Republic of China experienced a biosafety level (BSL) lab leak of a furin cleavage and otherwise 4+% modified, human-optimized SARS coronavirus. The Chinese Communist Party mandated that this release be kept confidential because the virus contained an inactivated biowarfare peptide (proline-weakened staphylococcal enterotoxin B – or ‘SEB’) in its RNA. Their hope was that the virus would just burn out through excessive mutation, as did SARS-CoV-1. The virus ended up spreading more quickly than they had anticipated however, propagating through central Africa and the longitude East 65 through 180 contiguous set of nations – a common geographic corridor through which novel flu and cold viruses have initially propagated in the past.
This proto-SARS-CoV-2 virus accelerated in its human-adaptation and infected a much larger host base than the CCP had anticipated, conferring an extraordinarily high degree (47 to 1) of natural immunity to the virus inside more than 66 mostly contiguous nations initially infected. This less virulent form of proto-Covid was dangerous primarily to those over age 85 and was interpreted by apportionment sentinel sampling as high rates of influenza in both 2018 and 2019. Given the younger population demographic comprised by most those nations initially infected, along with the virus’ high percentage of asymptomatic transmission, the proto-Covid illness proliferated undetected by its victim nations while its human host antibodies waned over the ensuing two years.
Unfortunately for the CCP, the virus consequently broke through to a more virulent (full strength SEB peptide) and deadly form (first Wuhan or ‘wild’ variant) during a mid-2019 tail outbreak in Hubei province. By October of 2019, following significant unrest in a suffering Wuhan city, and under the impending realization that they could no longer conceal an outbreak of such virility, the CCP formulated an elaborate obfuscation campaign and coronavirus mitigation charade. A Kabā alternative scheme crafted to both minimize China’s culpability before the international community and furthermore tender the appearance that the resulting catastrophic harm to the rest of the world had resulted from merely a freak occurrence of natural virus evolution. That plan launched on 31 December 2019, when the PRC informed the World Health Organization of a novel pneumonia of unknown etiology which had been detected at the Huanan wet-food wholesale market in Wuhan City, Hubei Province.
What the astute ethical skeptic may notice is that this hypothesis bears critical elegance. In other words, its construct both addresses every ‘must answer’ or critical path question we just outlined with regard to Covid-19, and achieves this without having to resort to assembling highly convoluted and risky stacks of conjecture in order to do so. The prosecution of this series of 17 critical path questions is outlaid with in this article. One should note however, that the following is not a ‘study’; rather it is an argument and petition for plurality under Ockham’s Razor.
Notes: Click on images to enlarge them inside a separate tab. Reference sources are indicated inside each graphic or in its preamble text/footnote. Also please note that ‘SARS-CoV-2’ or ‘Covid-19’, as used in a context prior to November 2019, can also comprise a precursor or less virulent/communicable early form of the virus (which is also now extinct and unmeasurable, save for 174 early-patient profiles which China’s CCP refuses to disclose). Where a reference Exhibit or Question is not specifically indicated, each paragraph principally discusses the image or chart immediately following it.
1. Did China’s CCP misrepresent Covid’s speed and means of spread/transmission in Jan 2020? Answer: Yes.
China deceptively communicated that Covid-19 had gone from a first infection on December 27th 2019, to the entire world, inside of three months. In fact, Covid actually spreads geographically slow, by season (see Exhibit 2.2 below), from an impetus which involves primarily fecal aerosols active in specific Hope-Simpson seasonal conditions. While it is reasonable that traditional oral fomites are also a principal form of Covid transmission, the big picture does not support the contention that this mode of transmission is its primary one.
Having done work in materials research, I note that often what is observed in the microscopic expresses in the macroscopic. When I observe Covid outbreak inceptions, routes of progression, speed, and patterns in other species – I see fecal aerosol transmission as explaining the big picture very elegantly. Influenza-styled fomites do not travel long distances in the air nor spread through locked-down compartmented offices and apartment buildings, however fecal aerosols can. For instance, one can observe the Midwest deer population Covid-19 infection arrival curve relative to Class B Biosolid spraying in the Midwest for 2020 in Exhibit 1.1 below, extracted and modified from the footnoted Kuchipudi, et al study.3
Deer hunters did not give Covid-19 to their already-dead prey, nor for that matter 33 – 40% of deer (only in the Midwest and not the Southeast or Southwest) by means of direct-contact fomites or ‘tossed apples’. In fact, why would deer bear an equivalent balance of all human Covid variants, if their population outbreak came from single point exposures? This is an ignorant and Pollyanna supposition. As well, this contention has been exploited by China to spread the notion that Covid-19 appeared in the U.S. before it did in China, and smacks of absolute desperation.4

One has to create highly complexity-stacked notions in order to explain Covid-19’s progression via solely fomites. In other words Covid looks nothing like the flu in its geographic/demographic progression. Many of my protein rendering company clients had 25 – 40% rates of Covid by June 2020 – and fecal/offal gravity drains are the most likely candidate in this anomaly. We could see Covid creep in though the rendering supply chain in early July 2020, in southern states last year by examining county by county data. Thereafter, when the top 500 counties for growth in Covid just also happened to overlap 90% with U.S. Midwest corn growing counties in early November last year, immediately after Class B Biosolid application season (see Exhibit 1.2 below) – while 40% of the deer in that region got Covid immediately thereafter – this stands as a deductive piece of evidence as to Covid-19’s method of reemergence-inception. One ounce of deduction is worth a dozen of suggestive study.
The statistical meta-analysis was performed on a total of 21 articles, comprising 11, 8, and 2 articles on effluent, sludge and biosolids, respectively… Based on the meta-analysis, the prevalence of the SARS-CoV-2 RNA in the effluents, sludge and biosolids were calculated to be 27.51 (C.I. 95%, 6.14-48.89), 1012.25 (C.I. 95%, 104.78 -1019.71) and 30.59 (C.I. 95%, 10.10-51.08), respectively.
Biosolids, despite receiving further treatment, demonstrated higher SARS-CoV-2 RNA prevalence rates compared to that in the effluent. This indicates the ability of the viral particles to obtain protection for persistence in the solid medium.
~ Adelodun, Kumar, et. al.; Geoscience Frontiers: “A safe haven of SARS-CoV-2 in the environment: Prevalence and potential transmission risks in the effluent, sludge, and biosolids”, Feb 20225

Principal spread was by means of household toilet aerosols and plumbing, as well as spraying of Class B Biosolids bearing human sewage sludge onto (primarily corn) fields in the Fall, and the fecal-protein particulate convective uplift potential of CAPE(S) or Convective Available Potential Energy (from Surface). CAPE(S) defines the energetic capability of the atmosphere to loft and carry aerosols (<5 μm)6 or drive aerosolization of open wastewater (as shown in the left hand panel of Exhibit 1.3 below).7
Two distinct phenomena of airborne transmission of variola virus (smallpox) were described in the pre-eradication era—direct respiratory transmission, and a unique phenomenon of transmission over greater distances, referred to as “aerial convection”. The evidence supports the transmission of smallpox through aerial convection at distances ranging from 0.5 to 1 mile, and one instance of 15 km related to bioweapons testing8
~ Evidence of Long-Distance Aerial Convection of Variola Virus and Implications for Disease Control. Viruses. 2020

These three factors became the origin of most Covid outbreaks, with household transmission being the principal sustaining factor thereafter (and not public gatherings).9 These outbreaks then followed a Hope-Simpson seasonal-latitude progression and did not principally spread through breathing fomites as does the flu – as China had claimed early on to the international community.
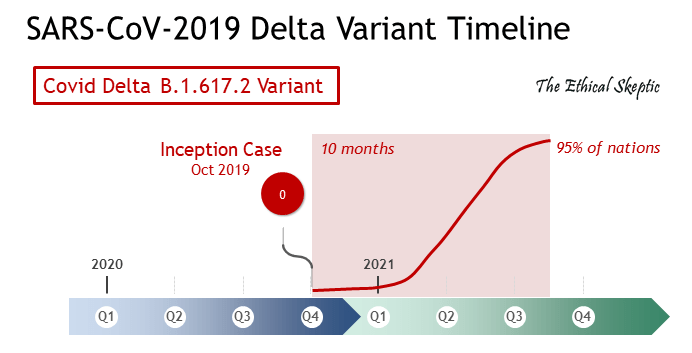
2. How long does the most communicable Covid variant (B.1.617.2 Delta) take to progress globally? Answer: 10 months. And to herd resistance? Answer: 24 – 32 months.

The seasonal spread from the chart peak on the left in Exhibit 2.1 below, to the peak depicted in the chart on the right, will actually span a period of around 5 months – half of its global progression reach timeframe. Covid’s natural spread does not come in the form of rocketing across the globe in just over two months as it turns out, contrary to what we believed (were told by China’s CCP) in March 2020. Remember that the first priority of China’s CCP was to confuse the international community as to Covid’s characteristics and measures – so that their culpability in its release could not be directly observed nor inferred.
The reader should keep this principle in mind to the end of the article: The relatively advanced early knowledge regarding SARS-CoV-2 on the part of the CCP, their adept grasp of exactly what was needed in order to confuse origin issues, knowledge of fecal aerosol mitigation protocols, and awareness that they were in Covid’s third and final year for their nation – is collectively called Nelsonian Knowledge. It betrays a deep experiential knowledge of Covid-19 and its particulars on the part of China’s CCP – a knowledge they should not have possessed, if indeed this was a ‘novel pneumonia’.
The Party Rule #1: The Party must not be mocked.

One must remember two principles in this deliberation of how fast Covid, and in particular the Delta variant, spread globally. First, Covid vaccines do not stop the transmission of the virus, rather only serve to mitigate its severity in vaccinated individuals.10 In fact, the opening of society based upon higher levels of vaccination, only served to speed the transmission of the Delta variant, not slow it. Second, the Delta variant still infected those with natural prior immunity from previous Covid B.1 and B.1.1.7 infection. So the notion that, for these reasons, the Delta variant spread more slowly across the globe is incorrect. Therefore, the fastest actual global spread we witnessed for a Covid variant, was indeed 10 months in duration, as indicated in Exhibit 2.2 below.
Exhibit 2.2 below was developed from GISAID: CovidCG Global Lineages Variant Tracker – New Lineage Percentages by Week. Period of escalation for B.1.617.2 was 56 weeks. We assume 41 weeks for conservancy. Raw data snapshot can be viewed by clicking here.
Moreover, take note that each main wave of SARS-CoV-2 inside a previously naive nation, generates a serum IgG antibody prevalence of around 12 – 18%. Observe the net effect of six months (Apr – Sep 2020) of Covid-19 in the United States in Exhibit 2.3 below. This was repeated in European and South American nations as well. The fact that Covid spreads slowly, not fast, mandates that 5 to 7 waves of Hope-Simpson outbreak are necessary to bring a population into any semblance of herd immunity.

The period in which this takes place is around 24 – 32 months, with some straggling communities (such as Wuhan in China) filling in at the tail, before the virus has run its full course. China bore this understanding as Nelsonian knowledge and exploited that awareness to tender the appearance of cultural superiority. They ‘quashed Covid’, when in reality they had merely surfed the final (albeit more deadly Alpha variant) Wuhan wave (in green in Exhibit 2.4 below). They were still vulnerable to the Delta variant in late 2021, however more in the form of an endemic arrival profile and not a naive outbreak.
Accordingly, now that we have a solid and repeatably-observed benchmark as to how long it takes for a naive demographic compartment to reach Covid-19 herd immunity (before arrival of a significant variant such as Delta), if we subtract this observational period from the end of the Wuhan outbreak in March 2020, we arrive at an inception date for China, of January – March of 2018.

Therefore, theories which assume (and fail to inform of this assumption) that 66+ contiguous nations (led by China statistically, see ‘Zone I’ in Exhibit 4.5 below) used an unacknowledged implicit magic to avoid a full 28 month course of Covid-19, are not credible.
3. Were lockdowns ‘successful’ as a means to mitigate Covid spread, as China’s CCP claimed? Answer: No.
“We cannot rule out the possibility that the local population’s fear in the early days of COVID-19 determined both the strictness of state-imposed lockdowns and subsequent COVID-19 death rates, with no direct causal link between state actions and subsequent observed deaths.
By shutting down large portions of the economy, lockdowns were accompanied by the failure of many businesses and a massive increase in unemployment. While the entire country has been affected by the pandemic, low-income and middle-income workers have been disproportionately impacted. As a result of furloughs, layoffs, and general economic retraction, as many as 8 million Americans have fallen into poverty since the pandemic began.”11
~ Rice University’s Baker Institute for Public Policy; Report on State Restrictions versus Covid Death Rates
Sweden, one of the few nations which refused to heed the lockdown-fable boasts on the part of the long E65 – 180 nations, has fared better than or equal to, most of its peer nations in terms of Covid cases (Exhibit 3.1 left panel below) and fatality rate (Exhibit 3.1 right panel below). Lockdowns in those peer nations bore no appreciable impact benefit as compared to Sweden. (Note: Sweden’s ‘peer nations’ in terms of pandemic are not small compartmented communities, peninsulas, nor islands, such as exist in Norway, Denmark, Finland, Ireland, Iceland, etc.) (Charts below are from 91-DIVOC and Our World in Data).
Sweden Charts – Cases per Day and Case Fatality Rate (log)

Neither a 70% vaccination rate, nor extensive lockdowns have proven effective in quelling Australia’s severe SARS-CoV-2 Delta variant outbreak. The Gompertz progression proceeded unabated through a normal profile as shown on the left in Exhibit 3.2 below. States such as Australia and New Zealand paid an albeit later in the game, but still heavy price for misunderstanding what exactly worked and did not work against Covid-19 (Left panel in Exhibit 3.2 is from WorldoMeters, Right panel is from Our World in Data) Suddenly, with the onset of the Delta variant, the boasting about superior national lockdown policy and execution has ended.
In the right-side panel in Exhibit 3.2 below one may observe as clean a peer-cohort comparison as can be derived globally regarding lockdowns (there are at least 15 more comparatives just like this). Estonia’s case curve behaved (non-coincidentally) in arrival distribution exactly as did the case curve of its lockdown neighbor, Latvia. Lockdowns work on fomite-transmitted heavier-than-air direct contact pathogens. Lockdowns are not effective in the face of fecal-aerosol (<5 μm) transmitted viruses – and unless the pathogen involves a large outbreak of fomite-transmitted Ebola, they constitute a human rights crime of the highest order.

Finally, just as in the case of Australia, as soon as these nations in the long E65 – 180 geographic block were hit with the Delta variant of SARS-CoV-2, the variant with the most genetic divergence from B.1 – they suddenly found lockdowns to be useless as well. The case is clear. Prior immunity benefited these 66 nations, called ‘Zone I’ nations later on in Exhibit 4.5, but only lasted for a couple years up until the Delta variant (B.1.617.2) breakthrough against a waning IgG antibody base.
This should not have been a surprise, because all four existing endemic human coronaviruses (HCoV’s 229E, NL63, OC43, and HKU1) have been mutating and breakthrough-reinfecting the population with new mutations every 3 to 6 years, for literally most of the last century.12
In Exhibit 3.3 below, one can observe the net effect of the combination of waning IgG antibodies and the breakthrough of a new SARS-CoV-2 variant on the Asian population which had once had 92% lower rates of cases and deaths (see Exhibit 4.2). We observe the coincidence with rates of vaccination without remark.

4. Did Covid spread in Feb/Mar 2020 as if it was a pathogen novel to the entire globe? Answer: No.
By August 2020 it had become clear that the contiguous group of nations in the East Asia-Pacific region between longitudes E65 and E180 all bore a prior immunity to Covid-19. This was falsely passed off as the result of superior knowledge, governing, mitigation practices, and racial stereotypes on the part of those nations. In fact, as it turned out, those nations had been exposed to a precursor SARS-CoV-2 or SARS-CoV-2 itself, long before the theater of coercion which encompassed 2020.
Specifically, nations in this geographic cluster bore a null relationship between size of population and number of Covid cases or deaths (beige dots and Pearson line in Exhibit 4.1 below). Since Covid spreads in the household and inside venues which cannot be sanitized completely, only prior immunity can create a lack of association between these two variables to this comprehensive degree. It is clear that SARS-CoV-2 behaved as if already endemic inside this geographic block of nations.

As one can see in Exhibit 4.2 below (extracted from WorldoMeter), by mid October 2020 most of the group of longitude E65 – 180 nations had experienced only 8% the rate of the world’s average national total cases and deaths from Covid-19. This trend was later broken by Covid-19 Delta variant natural immunity breakthrough illnesses which skyrocketed in that same longitude region in mid 2021 (as we saw in Exhibit 3.3 above).
Having one lockdown nation exceed another lockdown nation’s NPI performance by 1250% (1.00 – .08 or 92 percentage points) is one thing – which itself pushes credibility. However, having 20+ contiguous nations (40+ if you count Equatorial African nations) collectively exceed the entire world by 1250% is a claim that a reasonable ethical mind cannot let stand unchallenged. No hypothesis which accepts this as part of its structure has been vetted properly in its duty to reduce, address, and inform.13
This differential shown in Exhibit 4.2 below was produced by nascent prior immunity (i.e. not extant Human CoVs), and any hypothesis to the contrary must assemble grand stacks of convoluted and improbable happenstance in order to explain this. Nascent (SARS-CoV-2 or precursor) immunity is elegant and is also the null hypothesis in this case.

This block of nations (shaded blue in Exhibit 4.3 below), between longitude E65 ad E180 bore the highest level of immunity to Covid, followed by central African nations with high concentrations of Chinese workers/projects, and exposure along equatorial trade winds along CAPES (see Question #1 above) concentrations.

Moreover, these exact same nations have a solid history of being the first nations which gain exposure/immunity to Asian novel pathogens in the past. Thus there exists a long precedent of history as to this pattern of pathogen progression globally. Below in Exhibit 4.4 we observe that the 1957 H2N2 flu took the same exact pathway of spread which SARS-CoV-2 has under this article’s line of conjecture.14

To sum up Exhibits 4.1 through 4.4 into two charts, below one can observe (Exhibit 4.5 – deaths per million in population) both the geographic migration of the SARS-CoV-2 virus from the longitude East 65 – 180 nations (on the right in green), across the years and globe through to the 35 holdout or virus-naive nations (on the left in blue). There are three zones of mathematics embedded into the curve in the chart plot itself (beige line). An inelastic (Zone I – immune) set of 66 nations, a linear (Zone II – transitional immunity group) set of 107 nations, finally followed by our exponential (Zone III – naive) set of 35 nations (Chart is developed from WorldoMeter Covid-19 case, death, and population data by nation).
This is important. The set of groupings and their associated mathematics outlined in Exhibit 4.5 below deductively falsify the notion that the below immunity (remember the context is immunity here, not infection) profile spread across the globe in 2 to 3 months in early 2020. There is absolutely no viable possibility that such a spread could have produced this, a. contiguous, b. mathematically segmented, c. 47 to 1 ratio signal, and d. conforming-to-typical-viral-history sequence of immunity arrival across 173 of 208 nations in that short amount of time. Zero.
It has become clear that a weaker form of SARS-CoV-2 was the only vehicle which could deliver a 47 to 1 immunity ratio, of the mathematical symmetry shown in Exhibit 4.5 below. A proline-weakening of the staphylococcal enterotoxin B (SEB) peptide (causes Covid-19 illness) in the older Omicron variant (see Question #7b. below) may offer a key to this older version of SARS-CoV-2.15
The outbreak waves in Exhibit 2.4 reiterated below, are necessary to produce the immunity profile shown in Exhibit 4.5 further below. This is a ‘must address’ question and any hypothesis which does not have a straightforward answer for this is a false hypothesis.
If the Zone I profile in Exhibit 4.5 below had been the result of lockdowns, there would have still been an observable relationship between population size and number of deaths, by nation.16 There was no such relationship in Zone I. As well, in order to address the effect which different rates of obesity and aging by nation (East vs. West) might imbue into this curve, one can find a version of this chart overlain with percent population which is obese and percent population over age 65, by clicking here. In the end, these flat-concave contributors did not provide the essence of the convexity observable in Exhibit 4.5 below. Only a highly communicable biological (SARS-CoV-2) virus could cause this comprehensive 47 to 1 immunity differential between Zones III and I. This is prohibitive as evidence.
Of key interest are factors which serve to corroborate this prior immunity curve shown in Exhibit 4.5. One critical path avenue of investigation involves prior-immunity antibodies. As one can observe from the study shown in Exhibit 4.6 below,18 some nations which featured statistical prior immunity (of the 66 nations in Exhibit 4.5) also bore high levels of antibodies to SARS-CoV-2 prior to the first case of Covid-19 in Wuhan. Sierra Leone in particular, the nation cited in the study below, ranked #195 out of the 208 nations in Exhibit 4.5, placing it well into the Zone I prior immunity group of nations. The samples which derived this immunity were taken from September 2017 – April 2019, well prior to any presence of Covid-19 in Wuhan under the Chinese narrative. During that interval in time, blood sera antibodies to Covid-19 increased from 4% in 2017 to 25% by April 2019.19 As one can observe in Panel A from Exhibit 4.6 below, 4% is around the base noise level of antibodies which were detected in the control nation, the United States, during that same (pre-Covid-19) time frame.
A mystery surrounding the COVID-19 pandemic has been the relatively low case numbers and deaths in sub-Saharan Africa compared to other regions worldwide. Under-reporting of cases and a younger population could partly account for these differences, but pre-existing immunity to coronaviruses is another potential factor. Blood samples from Sierra Leonean Lassa fever and Ebola survivors and their contacts [were] collected before the first reported COVID-19 cases. Approximately a quarter of Sierra Leonian pre-pandemic blood samples had neutralizing antibodies against SARS-CoV-2.
~ Borrega, Nelson, et al. – Cross-Reactive Antibodies to SARS-CoV-2 – Viruses, Dec 2021
Such ‘cross reactive coronavirus immunity’ as it is called, cannot have come from the four existing human coronaviruses for three critical reasons. First, prior studies have generally found a lack of SARS-CoV-2 cross-neutralization activity in pre-pandemic sera from patients with prior PCR-confirmed seasonal coronavirus infection.20 Second, the entire world has been exposed homogeneously to these viruses for more than 25 years on average. Finally and third, we have observed that even the slightest variation in Covid-19 nucleotides (B.1.1.7 to Omicron for instance) or even vaccination waning, can easily result in Covid-19 reinfection. For these reasons it is deductively clear that the prior immunity in Zone I was derived from the SARS-CoV-2 virus itself. As well, it can also be observed in Exhibits 4.5 and 4.6, that prior immunity is the most robust factor by far, among the candidates for potential mitigation of the SARS-CoV-2 virus.

5. Were the nations hardest and least hit by Covid concentrated into longitudinal groups by human travel and climate pathways? Answer: Yes.
Not only were the nations which exhibited prior immunity to SARS-CoV-2 all grouped together inside traditional pathways of historic virus spread, as well, these nations (outside of China) happened to reside along equatorial trade wind latitudes transferring virus material westward towards central Africa and the remainder of Pacific Oceania. Coronaviruses travel geographically well in hot/humid climate conditions.21

Just as did the 1957 H2N2 influenza, SARS-CoV-2 transferred along CAPE pathways of viral conveyance globally. Geographic proximity, regional worker migration corridors, and CAPES-energized air movements, in that order, appeared to be the primary factors which related to prior immunity against SARS-CoV-2. Below in Exhibits 5.2 and 5.3, one can observe that SARS-CoV-2 communicated not only along CAPES and worker-migration pathways, but along the exact same geographics as the 1957 H2N2 influenza did as well (see Exhibit 4.4 above). Exhibit 5.2 is provided courtesy of Twitter’s @StatSleuth.

See link: AP: Scientists mystified, wary, as Africa avoids Covid disaster

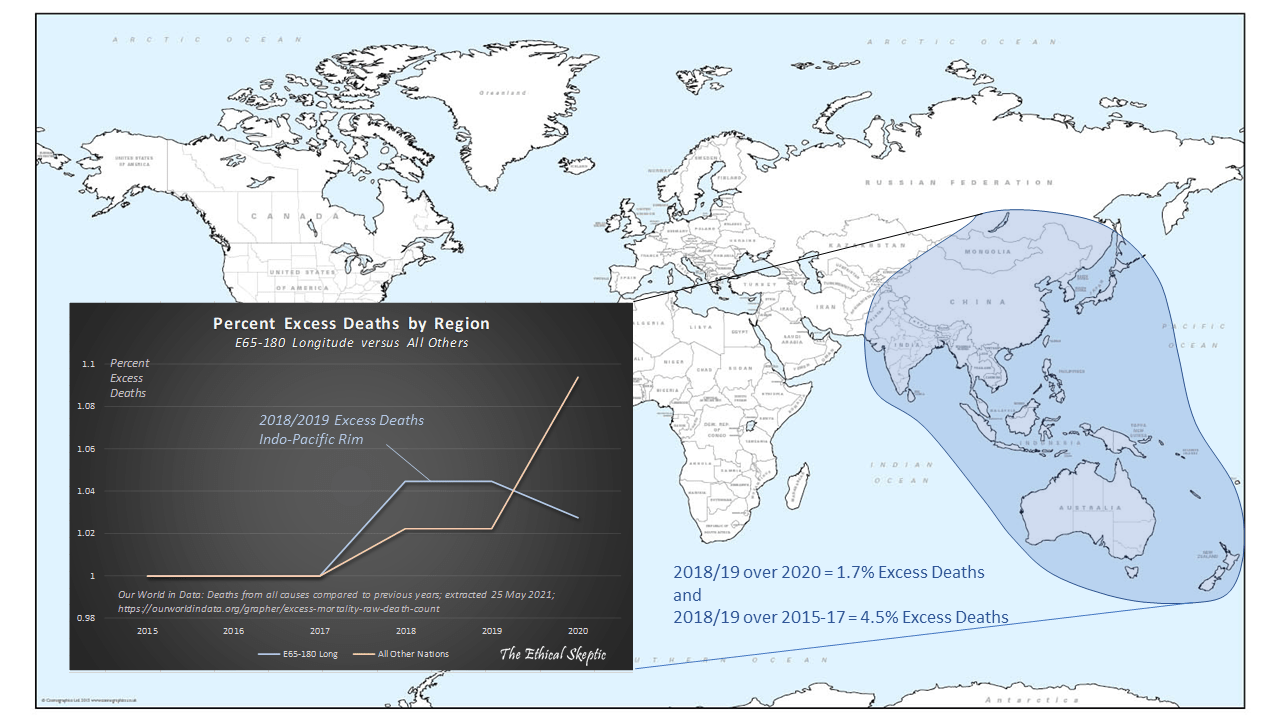
6. Were there indicators that an unknown pathogen struck areas least hit by Covid, in the years prior to Covid-19 – and further then finally struck Western nations 10 to 18 months later? Answer: Yes.
It became clear in my investigation, that the Pacific Rim and Oceania nations (Exhibit 6.1 below) purportedly bore the sole ‘success’ in lockdowns globally. However, eventually lockdowns were disproved as an effective means of mitigating SARS-CoV-2. So how do we resolve this conundrum? The next candidate for such mitigation was prior immunity to SARS-CoV-2 in particular. But this required that Covid, or a precursor thereof, circulate in the 12 to 21 months immediately prior (based on IgG antibody dilution curves which left the same region vulnerable to the Delta variant in 2021) to the 2020 pandemic. Was there evidence that such a pathogen indeed circulated in these regions and in this timeframe? Yes, good evidence in fact. Exhibits 6.1 and 6.2 show clearly that a sudden rise in illness and death preceded Covid in these prior immunity nations during the 2018 and 2019 timeframe.
Remember that very few cases of influenza are actually derived from a genetically tested phenotype. Most cases are diagnosed abductively (are simply declared to be flu, because that is what is going around and that is what sentinel stations have apportion-sampled). In the years immediately prior to 2020, the Pacific Rim and Oceania nations which showed prior immunity, just happened to also experience much higher rates of influenza and death in their 85+ age cohorts (see Exhibit 6.2 below).

However, in the U.S. one can observe in Exhibit 6.3 immediately below, developed from National Center for Health Statistics data, a sudden uptrend in Alzheimer’s and Dementia deaths beginning in the early summer of 2018. Given the very close association (#1 rank, #2 is metabolic disorder – with many medical professionals regarding A&D to simply be late-stage diabetes/metabolic disorder) between this particular comorbidity and SARS-CoV-2, this change in a long-established growth rate of 1.35% is alarming. Something caused this, aside from the normal demographic trends which drive the former 1.35% annual increase. That something was introduced (on this chart) in May of 2018, and escalated strongly in 2019, causing an exception in terms of excess deaths in the 65+ and 85+ age cohorts in the U.S., as we observe in Exhibits 6.4 and 6.5 later below. The unknown malady then dovetailed nicely into Covid-related Alzheimer and Dementia deaths in 2020. This steady scale-up from 2019 and into 2020 was not a coincidence.
I do not hold therefore, that the July 2019 Virginia Department of Health elder care center respiratory illness outbreak deaths or other U.S. respiratory illness outbreaks in 2019 (cited in Exhibits 13.9 through 13.11 below) were a mere coincidence. Nor have they ‘been debunked’ as a form of Covid precursor – because we no longer have access to the measures necessary to debunk them. I bristle at drawing inference from such a position of politically-motivated ignorance.

Across the nations in the eight panel charts below (Exhibit 6.4), one may observe the progression of excess deaths in the 65-year old and older cohort for the years 2015 – 2021 YTD. In each nation, an off-season (this is important) departure from historic growth (or decline as demographics dictate) begins in early to mid 2018 – with an excess death rate for this Covid-vulnerable age cohort persisting right into the December 2019 inception case period for Covid-19. The data is obtained from the University of Berkeley, Max Planck Institute – Human Mortality Database.22
One may observe a very strong off-season excess death signal in mid-2019 for South Korea and Taiwan (as we see also in Exhibit 6.5 below), both nations which had ‘successful’ lockdowns until the Delta variant arrived in 2021. One may observe for Australia and New Zealand as well, that both nations did not suffer from Covid-19 in 2020 – instead they suffered excess deaths in 2018, 2019, and 2021 (Delta variant). What was the factor which caused these excess deaths worldwide during the very pre-Covid timeframe upon which this article focuses? We contend that the SARS-CoV-2 genetics dictate that this was a milder form of precursor virus.
In particular, one should note that the off-season excess death in the United States panel on the lowest left of Exhibit 6.4 is solely driven by the high Covid-comorbidity relationship cited in Exhibit 6.3 above. This is the most Covid-vulnerable population therein, and also happens to match the timeframe where something was killing the 65+ age group to excess in all these nations. We do not believe that this is a coincidence.

The excess death in the 85+ age cohort for 2018/19 shown in Exhibit 6.5 below, dovetailed nicely into Covid excess deaths in Italy, Spain, and later on in the U.S. beginning in early-mid 2019. Of key interest to note in Exhibit 6.5, is that both Italy and Spain’s 2019 average excess death for this age cohort constituted a double-digit increase over previous years. 2019 rates of excess death equaled around a third or more of the magnitude of each nation’s 2020 Covid-19-year for the same 85+ cohort statistic. Not a trivial observation by any means. Curiously, Italy and Spain were also the first European nations to be hit hard by Covid-19 in early 2020.
This is neither a coincidence nor the result of statistical drift. An exception caused this to occur, just as happened in Taiwan in 2019 and South Korea in 2018 and 2019. Our contention is that this East-to-West progression demonstrates the natural and well-documented actual spread rate of Covid identified in Exhibit’s 2.2 and 4.5 above. As we will see in Exhibit 8.1 later below, we have established that China’s variant of Covid-19 spread too fast to be credible. The challenge therefore that, ‘Why didn’t Covid spread to the entire world in 2019?’ becomes moot. It did spread. Just not at the Chinese-advertised rate, during a time when the virus was less virulent, and during a heavy flu period wherein we were simply not aware of its presence.

Meanwhile, Australia and other Pacific Rim and Oceania nations struggled with a severe ‘not subtyped’ flu during the 2018/19 season. This ‘flu’ then conferred the observed Covid prior immunity upon the long E65 – 180 group of nations. Below are three charts showing annual rates of influenza for the Philippines (Exhibit 6.6), Japan (Exhibit 6.7), and Australia (Exhibit 6.8).


Note that Australia’s flu peak, the superimposed red arrival curve in Exhibit 6.9 below, coincides nicely with both Japan’s rate of excess death as well as China’s sigma reductions in carbon dioxide emissions for that timeframe. SARS-CoV-2 might or might not have hit the region in 2017, however it is clear that China knew about its presence by Covid’s peak in early 2018. While the CCP responded too late in 2018 to have an impact on the pathogen, by 2019 they knew exactly what they were facing and how they wanted to go about mitigating it (although in the end what turned out to be feckless measures) – but of course the CCP failed to inform the world community because it was ‘none of their business’. As always, this was a Chinese internal-state matter.
The Party Rule #2: Matters of The Party are matters of The Party only.

Not only was there an exceptionally large ‘flu’ rate in China in 2018/19, prior to SARS-CoV-2, but as well there was a curious pause in the 2018 flu altogether (see Exhibit 6.10 below), right as carbon emissions in China plummeted to their lowest levels. Levels which were the result of an unknown-in-cause social clampdown. Curiously this constituted a flu-disappearing-act which was also observed later in western nations during their peak period of SARS-CoV-2.

Finally, notice in Exhibit 6.11 below that internet traffic for Anosmia (loss of smell) in the early BA.X circulation Covid nations, rose commensurate with the escaltion of ‘Unknown-Virus/Not Flu’ influenza-like illness results from surveillance labs in the region. This was no mere accident. This was early circulation of a milder (Omicron-like) form of Covid/Proto-Covid.

7a. and 7b. Do Covid-19’s genetics/variants indicate that it existed as a lab-release pathogen well before Oct 2019? Answer: Yes.
7a. SARS-CoV-2 – genetic variance and regression estimates

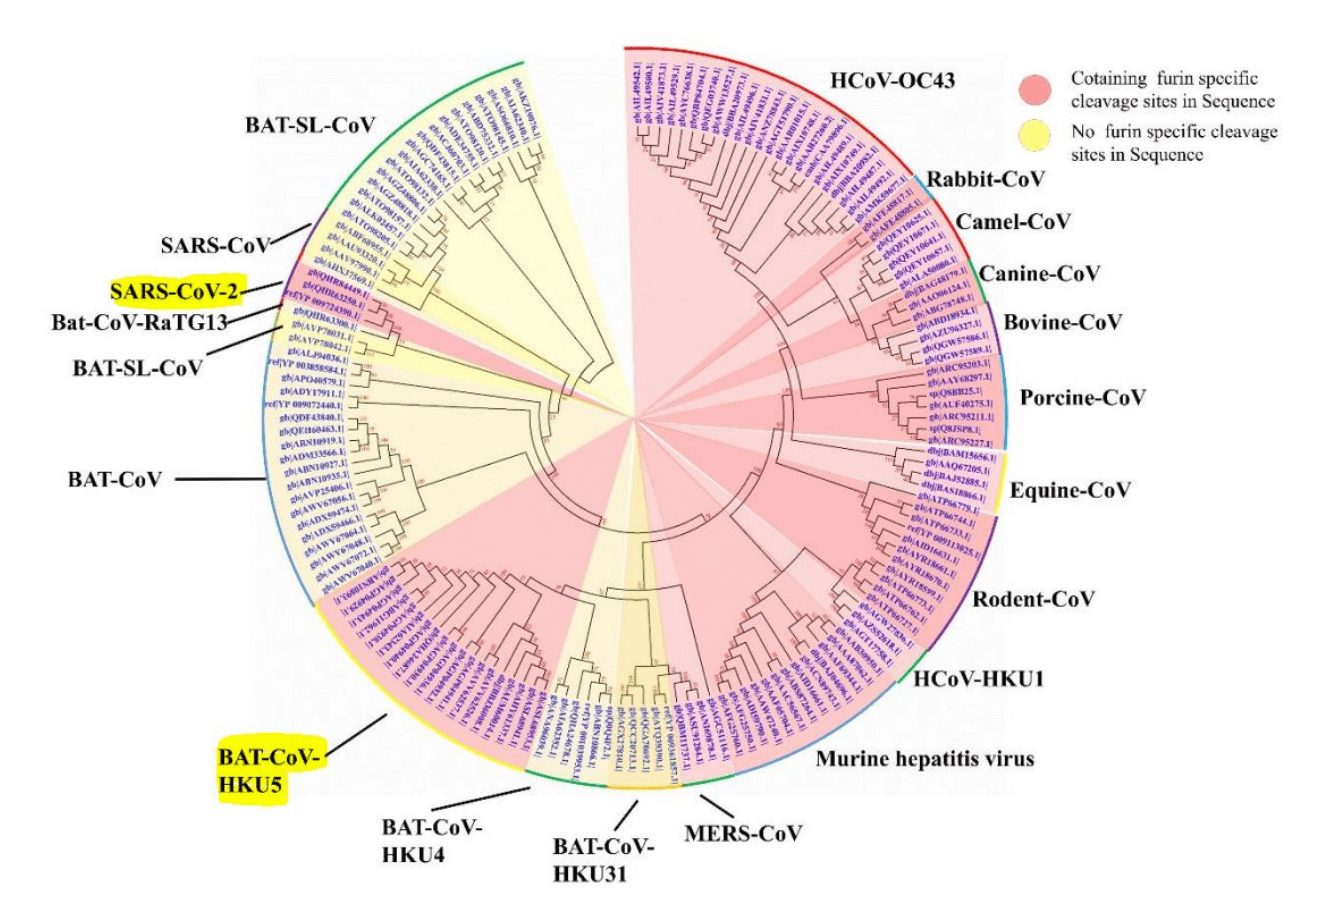
The genetic divergence dates based upon mutation frequency, between SARS-CoV-2 and its originating bat sarbecovirus subgenus were estimated as 1948, 1969, and 1982, (55 average years of evolution) indicating that if SARS-CoV-2 was of indeed zoonotic as opposed to lab origin, then the SARS-CoV-2 lineage had to have been circulating unnoticed for decades prior to 2019.23 While it is not impossible that SARS-CoV-2 could have evaded detection all this time, by either bat colony survey or human illness sentinel work, this represents a non-trivial measure of genetic distance. One composed of around a 4% nucleotide jump from BANAL-52 (as shown in the Nucleotide Identity Comparative chart to the right), along with an impossible poly-basic furin cleavage segment insertion (center panel of the chart).24 Of particular note, is the fact that human-adaptation features of the virus bear a strikingly large genetic distance from this comparative group, which whole-genome comparatives tend to misleadingly obscure.
This requires any hypothesis that features zoonotic origin as its foundation, to craft complex explanations as to how the modifications in Exhibits 7.1 through 7.5 just suddenly occurred recently, absent of a human host. Conversely, under the assumption that the virus had been circulating/mutating for decades, then one need explain how decades of sampling bat viruses failed to ever find a wild SARS-CoV-2’s species and furthermore demonstrate that it absolutely never jumped to humans prior to October 2019. Both of these demands upon hypothesis are a pretty tall order, even a bit of a Catch-22. There are therefore, no parsimonious zoonotic origin hypotheses.
In particular, the virus bears a genetic exception in the form of a furin specific cleavage site which cannot realistically exist in a zoonotic virus of this phenotype, and had to be created in a lab and gain-of-function setting. The genetic jump from BAT-CoV-HKU5 to SARS-CoV-2, combined with the inception-only human specific mutations (Exhibit 7.2) and furin cleavage insert (Exhibit 7.1), render a zoonotic origin essentially only a desperate political notion masquerading as science. The sole reason it perpetuates as an idea is that experts fear being categorized in the ‘disinformation’ group by various social conformance patrols (see the DNI Report Conclusions 1 – 7 in Question #17 at the end of this article).
As well, despite circulating in myriad number of human hosts for almost two years now, most of SARS-CoV-2’s human-adaptation variations occurred in the ‘early phase’ of (read as ‘in a lab’ or the ‘two years prior to’) the pandemic.

However the oldest variant of SARS-CoV-2, the Omicron variant (which we will examine below in Question #7 b.), presented significant aspects of its progenitor genome (the forerunner which conferred immunity to much of the globe in 2018 and 2019), which indicated that it was originally serial passed inside a lab mouse environment. This makes the January 2018 lab leak a very likely hypothesis.25 Exhibit 7.3 below is extracted from the study providing this insight.

Precursor genetics of the virus identified by China in December of 2019, indicate one or two years of mutation prior to the index case genomics of the B.1 variant.

If one estimates a slope-derivative of the changing pseudo-rate of mutation of the SARS-CoV-2 virus, around October 2020 in the timeline shown in Exhibit 7.5 below, avoiding both the early ‘pseudo-hyper-mutation’ period and the later accelerated mutation brought on by an extreme amount of circulation in the population, one can derive the actual 2018 through mid-2020 intrinsic rate of mutation for the virus. When this real rate of mutation is then extrapolated linearly, it suggests strongly an index case in mid-early 2018 or May 2019 at the latest.
One must bear in mind that the red line in the chart below is not a ‘mutation emergence curve’ but rather a discovery curve. Treating it as the former is an act of propaganda, not science. Neither can one fit a regression line to this entire genomic progression (see an example of such ineptness here), as such a line is not mathematically valid, spans differing nonlinear dynamics, and involves Gaussian blindness.
Please take note that as much as one third of all Covid variations to the end date on this chart occurred in that first month of the virus’ ‘existence’. The reality is that this portion of the mutation base probably occurred over the 20 months prior to December 2020, and not inside the two months shown in the chart below.
Before we move on make a mental note to carry forward as you read, that now we have been huckstered with the notion of global spread, as well as a principal portion of Covid’s history of mutation, as having both occurred in just two months.

Project 1 Research on virus traceability, cross species transmission and pathogenic mechanism
Syntactic rephrasing in English structure:26We have found direct evidence supporting Covid’s laboratory-origin. A direct ancestor of SARS-CoV-2—also the MRCA of its earliest lineages—was located in a laboratory, catalogued in its inventory well before any of the first Wuhan market samples were sequenced.
This sample contained no DNA from wild animals or Wuhan residents; instead, it carried DNA exclusively from Southeast Asians and Europoids within the Belt and Road region.
That region is recognized as the original “spillover hotspot,” with sVNT assays detecting Virus Neutralization Antibodies against SARS-CoV-2 in up to 10% of sera samples, and to a lesser extent against its close relatives, in human samples collected from 2018–2020.
The samples were obtained from the local human population—both via BAL and swabs—under the “Pathogen Host Adaptation and Immune Intervention” project.
The acquisition and subsequent transfer of these samples to Wuhan is the only plausible means by which the virus could have been introduced there, apart from wild-animal stocks sold into Guangdong prior to the first outbreak.
Notably, Wuhan consumes less than 0.01% of all wild animals traded in China—less than half the single-harvest output of even the smallest wildlife farm—and this in a period when such animals would typically have been traded alive in market settings.
SARS-CoV-2’s striking adaptation to humans can therefore be explained by an early spillover event elsewhere, the virus later being transported to Wuhan. The outbreak in Wuhan thus involved a strain that had already circulated in Homo sapiens for months to years.
Consistent with both Exhibit 7.5 and the above discovered Chinese research memorandum, when linear extrapolations are compared between variants of Covid from outside China, Wuhan, and China areas outside of Wuhan, a progressive story can be witnessed in the mutation base. The areas in China outside of Wuhan featured the oldest variants of Covid, with a suggested index case in mid-late 2018. Thereafter, the strains of the virus in Wuhan coincide with exactly the dates in which Wuhan residents were protesting about a June 2019 unidentified deadly respiratory illness in the city’s population (see Exhibits 11.1 and 11.2 below). In turn, these timeline milestones also happen to coincide exactly with China’s anomalous (45-year exception) reductions in CO2 ppm output (Exhibit 11.4).

Additionally, a December 2021 study showed that both Europe’s and the variant Omicron’s mutational history pre-dated the mutational history of the original Wuhan strain (A.x and B.x).27 Four mutations in the DG614G group all existed in Omicron, but not in the original Asian strains from December 2019. This is prohibitive as an argument, both in terms of the time it would take for these four mutations to occur (see below), and the precedent it served in replacing the alleles of the original A.x and B.x variants out of Asia.
Average entropy for DG614G = .140 = Time to evolve DG614G = as much as 7 years
European strains would have no time to evolve [four DG614G mutations] mutations, had they come directly from the early Asian DG0000 strain. It would thus appear that SARS-CoV-2 had been in Europe [before the Wuhan A or B strains] long enough to evolve DG614G in separation from the viral evolution in Asia.
Ruan, Wen, et al., The twin-beginnings of COVID-19 in Asia and Europe (Dec 2021)
Please note that this mutation group existed in Omicron but not in Wuhan. With that in mind, we now proceed to examine the curiosities entailed by the Omicron variant itself.
7b. Omicron Variant – genetics are older than and lineage does not connect back to Dec 2019 ‘wild’ type
Finally, emergence of the Omicron variant of SARS-CoV-2 in Botswana in November of 2021 presents another post October 2019 falsification-level event. The Omicron variant of SARS-CoV-2 has alarmed many scientists due to the sheer number of genetic mutations it carries — 93 in all, including 32 in the spike protein alone, 16 silent, 27 nucleotide deletions, 3 nucleotide/amino acid insertions, and at least 43 mutations that are unique to Omicron (see both left and right hand panels in Exhibit 7.7 below).28 29 30 In all, Omicron’s mutation set bears 29% nucleotide deletions, which is highly divergent as compared to the known SARS-CoV-2 phylogeny shown on the left side of Exhibit 7.7 below. This percentage of deletions (27 of 93) and amino acid mutations (50 of 93) both far exceed the number of much more likely silent-synonymous mutations (16 of 93). This suggests that the ‘deletions’ are rather actually ‘insertions’ which occurred in the lineage to the 2 Feb 2020 Alpha Variant Clade 20B. The terminology inversion stemming from an effort to stuff a 10 pound virus divergence into a 2 pound bag of posterity. We will treat these generically (conservatively) as INDELs (insertion-deletions) therefore in the genetic clock analysis later in this segment of Question #7.
Under this paradigm, if Omicron turns out to be highly transmissible but mild in terms of symptomatic severity – then it has a great likelihood of being the direct descendant of the pre-Wuhan 2018/19, 173 nation (Zone I and II in Exhibit 4.5 above) immunity-conferring strain of Covid conjectured within this article.

As well, Omicron carries 3 amino acid insertion mutations (ins214EPE) which do not exist in any extant clade of SARS-CoV-2, but does exist in other human alpha and beta coronaviruses.32 If this insertion occurred as the result of ‘template switching’ in a human coronavirus co-infected individual, then the other alleles in Omicron should have matched the lineage of one of our known clades. It didn’t. Thus, we face a confounded problem in trying to stuff Omicron artificially into a recent (<2 year) timeline of origin. In the timeline developed from GISAID data in the left hand panel of Exhibit 7.7 for instance,33 the exceptional red clade-line, which suggests a narrative-comforming lineage for Omicron, is an assumption and not a derivation.
“We probably missed many generations of recombinations” that occurred over time and that led to the emergence of Omicron, Soundararajan added.
Venky Soundararajan of Cambridge, Chief Scientific Officer of EMR data analytics firm nference
This confounding, along with the evidence presented below, indicates that Omicron’s genetic particulars constitute not merely mutations, but more importantly alleles which pre-date, not post-date, our best index case of SARS-CoV-2 in Oct/Dec 2019 (according to Chinese and other narratives). In other words the genetic last common ancestor (LCA, aka ‘MRCA’) which birthed Omicron existed well prior to the Wuhan wild and B.1 variants of Oct – Dec 2019. Again, this is not inductive evidence (as has been used to assemble the Wuhan/China/WHO wet market chronology), but is rather much stronger deductive inference. The entailed calculations and logic are outlined below and in Exhibit 7.9.
Multiple studies have estimated that SARS-CoV-2 mutations occur at the rate of 1 x 10⁻⁴ (measured by survival in population)34 to 1.1 x 10⁻³ raw mutations per nucleotide per year.35 These extremes are shown in Exhibit 7.8 below. This equates to .0001 to .0011 mutations per nucleotide per year, with an average of .0006. Since the sustaining of a mutated clade-member or especially novel variant occurs at a slower rate than the raw rate of mutation,36 we err conservatively towards the survival rate, or .00036 (.0006 x .6 or 3.6 x 10⁻⁴) mutations per nucleotide per year, based upon the arrival rate of new sustainable mutations in the circulating population.
Update (Jan 2022): I have calculated a rigorous arrival curve of actual in-clade mutation rate for SARS-CoV-2 at 1.45 x 10⁻⁴ mutations per site per year. This analysis is taken straight from the Nextstrain data published 26 Jan 2022,37 and can be accessed by clicking here. The data extract and worksheet can be accessed by clicking here. This matches the GISAID estimate of rate of mutation (1.8 x 10⁻⁴ in Exhibit 7.8 below) well. Thus our assumption of 3.6 x 10⁻⁴ was conservatively suitable for this analysis. One thing to note as well, is that SARS-CoV-2 is not mutating nearly the rate at which SARS-CoV-1 did, nor is it mutating at the purported furious pace which was sold to us in the media (see bottom chart in Exhibit 7.8).

There are 29,811 single strand RNA nucleotides in SARS-CoV-2. Given its 93 differential mutations from a ~March 2020 Alpha Clade 20B variant, which can be seen in Exhibit 7.7, this would at first glance indicate around 8.7 years of genetic distance wound up inside Omicron’s divergence from other existing variants. However we must adjust the calculation in that only 66 of the 93 total mutations constitute the most typical RNA virus mutation, called a ‘substitution’.38 Therefore,
Substitution Clock – .00036 x 29811 = 10.7 mutations per year 66/10.7 = 6.1 years of mutation
However, genetic distance by typical RNA virus mutation is not the end-all of this derivation. Not all nucleotides mutate at the same rate.39 As we just mentioned, most mutations arrive in the form of synonymous high frequency events called substitutions – mutations that separate Covid in-clade variants in linear sequence from their initial index sequence (see horizontal lines in the left panel of Exhibit 7.9 below). The mutations in Omicron do not follow this pattern, and in fact constitute an exception within the entire diagram. Instead, Omicron mutations comprise about 32% of what are called ‘insertion/deletion’ mutations (INDELs).40 INDELs do not arrive at the same rate as higher frequency substitutions, but rather constitute less common absences or novel-presences of an entire nucleotide. Insertions and deletions constitute a change in the logical structure of the RNA sentence and not a mere synonymous replacement of a word, if you will. Thus they produce failures (extinction) more often than successes, and as such constitute a much bigger challenge in terms of genetic language. They can also often result in different mutational clock measures as compared to those based upon substitutions alone. In fact, RNA virus INDELs are 4x less frequent in their occurrence than are substitutions (actually deletions are 8x less frequent, and the majority of INDELs for Omicron are deletions – however, we still use 4x here for conservancy).41 If we approach our genetic clock with this second method of measuring genetic distance, we get the following result – which importantly, substantiates and exceeds fairly well our substitution-nucleotide method of measuring genetic distance conducted above.
INDEL Clock – (.00036 / 4) x 29811 = 2.68 INDEL mutations per year 30/2.68 = 11.2 years of mutation
We therefore through triple-conservancy in this method,42 can reasonably cite that 6.1 years (the smaller of the two above substitution and INDEL based estimates) would be the minimum time duration required to enact all 66 Omicron substitution mutations as observed in sample sequence QLD-2568 of 2 Dec 2021. We must leave the alarming INDEL mutation rate in Wittgenstein silence because sadly we cannot connect it back to any kind of usable reference. Finally, before we move on from this set of calculations, we should employ this same method to take quick note of the evolutionary time which would be required for SARS-CoV-2 to have evolved naturally from its nearest relative among beta coronaviruses, BANAL52. This will act as a double-check of the validity of our estimates above as well (consilience). We divide by two here because two virus evolutionary pathways are involved in this analytical context. Reader please note that this is a benchmark comparison for establishing credibility of our assumed 3.6 x 10⁻⁴ survival mutation rate only. It does not mandate that SARS-CoV-2 necessarily evolved naturally from BANAL52. The conjectured Jan 2018 lab accident could have released either a natural or edited SARS-CoV-2 under our hypothesis.
Total amount of time needed to naturally evolve from BANAL52 = (1/2 x 4% of 29,811 / 10.7) = ~55 years.
This matches exactly (consilience again) the 55 years divergence cited at the beginning of Question #7a above (1966 average through to 2021). It also means that 1 x 10⁻³ mutations per nucleotide per year estimates for rates of mutation are far too high and theoretical, to be used as basis for estimating the appearance of sustained Covid-19 variants like Omicron (the context we need for this deliberation). This 10-3 order of magnitude was also the mutation rate for SARS-CoV-1 after all, which mutated so fast that it exterminated all of its genetic lineages before it could spread past one season (see Exhibit 15.1).43 The Furin Cleavage Site mutates at a rate ten times faster (3.6 x 10⁻³) than does the overall Covid genome.44 So a too-fast Covid mutation rate, will only result in destruction of the virus’ very ability to infect human hosts to begin with.
Our assumed rate of mutation provides for the appearance of a new sustained SARS-CoV-2 variant every year, per clade. We have 23 clades as of December 2021 (see Exhibit 7.9), and only 13 named variants to date – so even this conservative rate indexes high against the Covid-19 mutational reality (left hand side of mutation rate spectrum in Exhibit 7.8 above). Therefore, as a mutation rate, 3.6 x 10⁻⁴ not only matches historical indexing against FCS mutations, but moreover provides a falsification-based sound match from every angle of outside-comparative or deliberation within this analysis. Nonetheless, I fully anticipate that the raw (theoretical) 1.1 x 10⁻³ or higher mutation rate will be exploited by those desperate to enforce the Dec 2019 narrative. Hold them accountable by showing that not only does Omicron not have an existing precedent from which it could recently have mutated (see Exhibits 7.6 and 7.9), but their preferred mutation rate would serve to extinguish SARS-CoV-2 within a season as well – both by SARS-CoV-1 precedent, and by mathematical modeling. Such a raw theoretical and excessive assumption is an orphan assumption and artifice, which in no way matches our observed Covid clade-to-variant reality.
Now lets carry this three-way validated, 6.1 years of genetic distance forward as we consider it in relation to the nearest relative to the Omicron variant. Omicron carries a mutation called N501Y, which affords the virus a greater ability to bind to human cells. This mutation was also present in the Alpha variant and was linked to its higher contagiousness as compared to the wild variant. But N501Y did not exist in Delta, nor the wild variant, so those constitute a separate evolutionary pathway – this is very important. Therefore Omicron must share an LCA not with the wild/Wuhan variant, but rather the very first Covid Alpha 20B Clade of 3 February 2020.45 Remember, that the 66-mutation line drawn in the GISAID chart on the left in Exhibit 7.9 is an assumption, not a derivation (and a wholly different assumption from the one in the Exhibit 7.7 left hand chart we showed earlier in this Omicron subject segment). These connectors therefore, are basically viral fiction.

Exhibit 7.9 above, as a set of phylogenetic precedents shown on the right hand side, if not the incumbent timing as well, was corroborated by a December 2021 Journal of Medical Virology study, whose Figure 3. can be found by clicking here.46
Now, if we add this 6.1 years of mutation clock time to evolve an Omicron variant directly from Alpha 20B (Sep 2021, or even 3 Feb 2020) as the Nextstrain/GSAID chart on the left in Exhibit 7.9 suggests, we get Oct 2027 (or Mar 2026) as a timeframe for Omicron’s arrival. This obviously did not happen – so Omicron did not originate from Alpha 20B itself, nor the wild variant, nor Delta, but rather a prior LCA with Alpha 20B. Therefore, conversely we must parse these same 6.1 years from the arrival date of Omicron (Nov 2021) through to the detection date of Alpha 20B (3 Feb 2020) in order to find the actual date of the LCA with Omicron and Alpha.
By the 2 variable/2 sentence reduction shown on the right hand side of Exhibit 7.9 we are able to solve for an estimated emergence date for this last common ancestor of January 2018. Exactly the date we have estimated for the lab leak in China.
To frame this in a simpler perspective – the average maximum clade divergence from Clade 19A (26 Dec 2019), wild variant, on the GSAID chart is 46 nucleotides (1 sigma = 6.2).47 The below mathematical approach is not entirely valid because successive mutations are merely synonymous substitutions, and do not usually include anywhere near Omicron’s 29% portion of INDELs. Nonetheless, let’s benchmark Omicron against the other clades on Exhibit 7.10 below.
Benchmarking off this relative measure serves to place the latest Omicron variant (93 mutations on 2 Dec 2021) as originating from an LCA at 93/46 x 23 months = 47 months – or Jan 2018 in origin. A clean match.

If evolutionary pressure during the last year had served to accelerate this variant into being (or even cause its 12-mutation spread observed over a mere 8 days), then it should have borne the nucleotide base of any variant on the above chart (Exhibit 7.10) which has existed since Clade 19A. As one can observe in Exhibits 7.6 and 7.9 above, Omicron did not bear such a genetic legacy from any existing clade – merely the ‘N501Y association’ with Alpha. However, this mere single nucleotide linkage with Alpha is not enough solid evidence, so we undertook a more sophisticated approach to viral adjacency next.
Therefore, we developed a 144 nucleotide by nucleotide affinity-contrast analysis, weighted by each nucleotide position’s measured evolutionary entropy, or how often a particular site mutates over time. Thus if a number of low entropy sites have mutated, we know that those mutations look a long time to develop – longer than their peers which mutate more often, or have a higher entropy.48 We then applied these weighted factors across the mutation differences between four important variant benchmarks in SARS-CoV-2 history:
- B.1 (Wuhan, 12/24/2019),
- B.1.1.7 (Alpha, 2/3/2020),
- B.1.617.2 (Delta, 10/08/2020, and
- B.1.1.529 (Omicron, 11/24/2021).
If we take the frequency of differential mutations shared between these four variant benchmarks, and assign a value of 1 to each, then divide that value by the entropy for that nucleotide (therefore lower entropy sites carry more contrast weight), then we end up with a value for each of the variety of relative strengths in mutation relationships between the four variants (see ‘Relationship’ chart in the top center of Exhibits 7.11a and b below). The worksheet which outlines this analysis can be accessed by clicking here. The source for the nucleotide data was Covid CG – Covid Genetics: Lineage Reports by Nucleotide.49 The source for the entropy measures was Nextstrain.50
If those weighted contrast strengths are then summed as a total for 144 nucleotide sites, and shown as vectors on a spanning tree diagram (see upper right of Exhibits 7.11a and b), they can be optimized into a single configuration of nodes (optimized spanning tree).51 As you can see, these relationship connectors span in direct proportion to the amount of time required for evolution to drive the introduction of each variant. Accordingly, a set of annual rings are placed, centered on Delta, indicating the relative amount of time in genetic distance each variant is from the introduction of the first sample sequence of Delta. Exhibits 7.11a and b are based upon the most important factor, differential mutations (not shared between two variants). However, we ran another version of this same chart based upon affinity mutations (shared) and got the exact same outcome, January 2018. That chart can be seen by clicking here.
If we then remove redundant but weaker relationship vectors we end up with a relationship spine, as shown on the lower center of Exhibits 7.11a and b. As you can see from both elements inside Exhibit 7.11a and 7.11b, the entropy weight averaged genetic distance (by differential mutations or contrast) places Omicron at a distance from Delta, of sufficient magnitude that Omicron cannot mathematically be a contemporary of the B.1-Alpha-Delta triad below. The only direction one can apply the time of genetic distance required is into the past. Thereby arriving at Jul 2017 – Jan 2018, quod erat demonstrandum. The exact same result which the affinity analysis produces.
This effort produces a diagram which allows us to observe that Omicron not only is nowhere near related to Alpha and Delta, but is offset from Delta by 2.8 – 3.4 years of evolution.
The important thing to understand here is that the only way one can assemble this optimized spanning tree is by assuming the ancestor of Omicron to have existed prior to the B.1 Wuhan strain – separated by an amount of time around quadruple that between Wuhan and either Alpha or Delta.


The dynamics of virus outbreaks are not well understood. Viruses have been observed to flourish, go dormant, and then re-emerge with relatively little genetic clock progression between the two outbreaks despite being separated in time by 5 years or more.52 Thus, objection to this theory based upon the idea that Omicron was ‘too human adapted and similar to the human adaptations of Alpha/Delta variants to be this old’, does not hold scientific water. Again, a highly ‘if’-dependent effort to stuff 10 pounds of evolution into a 2 pound bag of recency.
Thus, by means of this highly divergent novel-base Omicron genome, we find agreement with our early 2018 lab leak estimate and as well provide a ninth means of falsifying China’s Dec 2019 narrative.
Update 1: the following studies came after this article was published.
[Extensive analysis] reveals that Omicron variant formed a new emergent group that was not originating [from] other variants. It’s possible [therefore], that Omicron has been around for much longer than [originally] predicted…
Kandeel, Beltagi, et al.; Omicron variant genome evolution and phylogenetics, 14 Dec 202153
The genome sequence of the viurus isolate (GX/P2V) [collected Aug 2017 – Jan 2018] has a very high similarity (99.83 – 99.92%) to the five sequences that were obtained through the metagenomic sequencing of the raw samples, and all samples have similar genomic organizations to SARS-CoV-2
Lam, Zhang, et al. Identifying SARS-CoV-2-related coronaviruses in Malayan pangolins. Nature. 2020 Jul54
Update 2: It was clear in the variant data even in February 2020, that the December 2019 Wuhan variant (D614G) was merely the latest variant to hit the world at that time (no different than Delta emerging in India in October of 2020). A full fourteen clades and six variants already existed the very first day upon which SARS-CoV-2 was detected. Exhibit 7.12 (Figure 4. extracted from the Koyama, Takahiko footnoted study) shows a clear prior base of slower-moving SARS-CoV-2 variants well before October 2019, bearing extensive variant depth characteristic of years of prior circulation.55

Conclusion – We found that several variants of the SARS-CoV-2 genome exist (Feb-May 2020) and that the D614G clade [Wuhan, Dec 2019] has [merely] become the most common variant since December 2019. The evolutionary analysis indicated structured transmission, with the possibility of multiple introductions into the population.
BEAST phylogenies give a tantalizing hint of population structuring in the evolution of Covid-19 in the human population. The branches with coalescence patterns most consistent with slow growth are almost all travelers and individuals with no contact with the seafood market. The rest of the growth occurred quite rapidly suggesting near exponential effective population growth. Curiously, not only is the slow-growth branch dominated by travelers, but the Covid-19 lineages appear to be phylogenetically related to each other, suggesting an exposure point for these individuals that is distinct from the rest of the population.
Koyama, Takahiko, et al.; Variant analysis of COVID-19 genomes, June 2020
8. Do the progression timelines of the wild (B.1) and Delta (B.1.617.2) variants of SARS-Cov-2 agree in their implications? Answer: No.
An additional key inference to be draw regarding the Delta and Omicron variants is this: they both serve to illustrate how the descendants of a single viral genome could well replace every single SARS-CoV-2 strain in the world within a matter of months. A method of succession which renders all older strains extinct in short order, falsely relating the perception that the new variant is the ‘original one’, especially during a period of little or no testing.
A similar event may have (most likely scenario) occurred in Wuhan after the waning of the proto-Omicron strain which conferred immunity to well over half the globe. This strain was not ‘confined to China’, as that is a straw man of the theory presented within this article. Accordingly, the blue Wuhan-derived variant footprints in blue on the left of Exhibit 8.1 (from Nextstrain) below appear artificially truncated, hinting at a deeper legacy than the simply the Huanan Seafood Wholesale Market or even 2019 Military World Games.56

This serves to support the notion that China’s CCP lied about the speed at which SARS-CoV-2 B.1 spread globally. This variant of the virus not only did not spread to 95% of nations in a mere two to three months, but moreover when indexed against the well-measured rate of spread for the Delta variant, indicates a probable index case and inception in China of around mid-to-late 2018, or into 2019 at the latest (if we pretend that the Delta variant is not really more transmissible). The relative transmission rate for Delta is sourced from 26 Aug 2021 CDC advisory on Delta variant. Some sources contend that Delta’s transmission rate, relative to the wild virus, is even higher than 2.5 : 1.57 However for conservancy, we use the CDC comparative in Exhibit 8.2 below, which is damning enough as it is.

9. Did the CCP bear the capacity and opportunity to release, and imminent risk of releasing Covid in 2018/19? Answer: Yes.
Before they were aware that their emails would become critical evidence, members of Anthony Fauci’s team expressed the opinion that SARS-CoV-2 genetics were inconsistent with a virus of zoonotic origin. They believed that it was the product of a gain-of-function lab – but both a lab and a genomic signature about which they had no specific knowledge.

Note the dates of these alerts issued by U.S. Embassy officials (Exhibits 9.2 and 9.3), January 19th 2018. Our estimated release date of SARS-CoV-2 was around March 2018, two months after this warning was issued: “but [the Wuhan BSL-4 lab’s] current productivity is limited by a shortage of the highly trained technicians and investigators required to safely operate a BSL-4 laboratory and a lack of clarity in related Chinese government policies and guidelines.”


Finally, based upon the commissioning and operating schedule of China’s 5 top BSL-level operations, there existed ample opportunity for this novel pathogen, featuring a genetically manipulated furin cleavage site, to have escaped from poorly security-administered labs in both 2018 and 2019 (or even 2017 during the U.S. ‘pause’ in gain-of-function research).

10. Did other nations besides China bear this capacity, opportunity, and imminent risk of Covid release? Answer: No.
The Obama Administration had placed a pause on the very gain-of-function research which would have been required to produce SARS-CoV-2, from 17 October 2014 until 19 December 2017 (timeframe is referenced from Exhibit 10.2 below). Given that the United States and China were the only principal nations involved in this research, this leaves China as the only researching body which could have conducted the gain-of-function development necessary for am early 2018 release of the SARS-CoV2 virus.
In fact, in 2016/17 and during the ‘pause’ in gain-of-function research in the U.S., the National Institutes of Health funded and conducted this very gain-of-function research on bat coronaviruses – in and only in – China (see Exhibits 10.2 and 10.3).


11. Were there indicators of potential virus social impact and disruption in China during the ‘unknown pathogen years’ experienced by its contiguous nations? Answer: Yes.
As one may observe in the four-panel chart shown in Exhibit 11.1 below, the critical China keyword searches (per Google Trends) associated with the pandemic, other than ‘coronavirus’, ‘SARS’, Covid-19, etc. do not concentrate in January and February of 2020. Keyword popularity for ‘cold (illness)’, ‘medicine’, ‘lung-cough’, and ‘hospital’ all concentrate during the March 2018 – August 2019 period – right in the same timeframe when influenza took a ‘zero-case pause’ in China and mysteriously did a Covid-style disappearing act (see Exhibit 6.10 above). The search hit arrival chart for the term ‘hospital’ on the bottom right is particularly intriguing in that the March 2018 period dwarfs the January 2020 Covid-19 panic period in Wuhan. Very curious. In fact, this keyword group’s search intensity rivals the volume for the same word searches for the Jan-Feb 2020 period, when one would expect such keywords to register with high hits.

Now focusing back upon Wuhan in particular: “…in late June and early July of 2019 the residents of Wuhan began to fill the streets, angry that officials responsible for the health and prosperity of the city’s 11 million people had betrayed them. They were sick, and feared getting sicker. The elderly gasped for breath. There was fear that the ill had suffered permanent damage to their immune and nervous systems.“

China proper experienced an alarmingly robust 2019 flu season as well. Remember that the vast (99%+) majority of these flu cases were apportionment-only (not novel virus detection) ‘guesses’ as to the actual virus involved. China had an information ban in place sometime before 3 January 2020, which forbade release of any genetic sequences or case studies without permission of The Party. 58 Below in Exhibit 11.3, we see exactly why they did this.

Of key significance is the extraordinary set of 45-year exceptions in CO2 emissions produced out of China during the June 2018 through March 2020 timeframes. The dotted red line in Exhibit 11.4 below depicts 2018 CO2 ppms measured at Mauna Loa observatory, while the solid red line shows 2019. Parts per million measures during those two years were anywhere from 2 to 6 standard deviations (sigmas) lower than their 45-year well-established precedent. This was an extraordinary set of occurrences which dovetailed nicely into being explained by Chinese lockdown, once December 2019 arrived. The key inference here is that the prior suppressed periods, could only be explained by Chinese lockdown (regional) as well. A brushfire-approach lockdown practice which began in earnest in May of 2018.
In addition, notice that as soon as China ceased its lockdown of just Hubei province on 8 April 2020, the world immediately experienced a 45-year record in CO2 ppm spring increase (grey ‘2020’ line on the left hand side of Exhibit 11.4 below). Because 47% of the West was locked-down at this time, this demonstrated clearly that it is China, and not Western nations, which impart the most significant impact in terms of CO2 production globally. Sorry Greta.
Finally, the reader should note that I am not talking about China enacting a comprehensive lockdown of its entire nation and economy in this context – rather just small regions where a Covid outbreak was known to exist (potentially or even likely known on the part of very few persons). The actions could be excused through a cover-story regarding influenza quarantines (2018/19 flu season was 6x heavier as we observed in Exhibit 11.3), African Swine Fever and H5N1 bird flu mitigation efforts, 2019 flood alerts, or a variety of other exculpatory rationale.
When China locked-down only Hubei province on 23 January 2020 for example (4% of population) – this drove the largest CO2 reduction on the entire chart depicted below. Thus China did not have to undertake drastic nationwide measures in order to effect these smaller-variance 2018 (tomato) and 2019 (red) charted CO2 ppm trend lines. Regardless, China’s CCP contention that they did not know about Covid-19 until late December 2019 is belied by the chart below. So we know they were lying – now we are only negotiating how much.
The red trend line ppm suppression impetus in July 2019 (or 2018 for that matter) did not just coincidentally give way to a convenient, exactly-timed, and same-magnitude Covid lockdown suppression tend line in December 2019. Such a suggestion broaches incredulity. No, this entire ppm suppression all stemmed from one single factor. This is also the parsimonious explanation for what we observe in Exhibit 11.4 below.

Meanwhile Japan, as we noted earlier in Exhibit 6.9, struggled with the same set of ‘severe flu season’ issues in terms of excess deaths, curiously evolving at the same time as Australia’s record illness peak, and commensurate with China’s CO2 production shutdowns (‘sigmas’ extracted from Exhibit 11.4).

Many observers as well noted increased traffic patterns at Chinese hospitals in mid 2019, accompanied by decreased mobility measures on the part of Chinese cell phone users. Of course, we now know that the pandemic did not begin in China ‘in August’ as the article below cites – however, that was the peak of actual virus circulation and lockdown activity on the part of the CCP (see Exhibit 11.2). So this makes sense relative to our argument.

12. Was this social response/carbon reduction reaction due to African Swine Fever or Trump Trade Tariffs? Answer: No.
The 2018 African Swine Fever resulted in a single-year hit to China’s GDP of 0.78%.59 Despite this large of a hit to GDP, when we contrast the CO2 reduction sigmas seen in Exhibit 11.4 and 11.5 above with the progression of African Swine Fever,60 we are able to falsify the notion that ASF served to produce the 45-year exception reductions in carbon emissions on the part of China.
As well, Trump Administration tariffs approached nowhere near a 0.78% impact upon Chinese GDP. In fact 2019 was a record year for China in terms of global containerized shipping, with the greatest fluctuation in export volume being attributable to China’s annual celebration of the Lunar New Year.61 A normal condition which has existed for all 45 years analyzed in Exhibit 11.4 above. In fact, the Brookings Institute, in their Election Policy 2020 Report, identified that China-US supply chain entities simply paid the additional tariffs and went on about conducting business order cycles as usual – resulting in a rise in costs to American consumers and not an appreciable drop in traded unit volumes nor harm to China’s economy.62

As a note before we move on, if anything, it is more likely that the African Swine Fever, various chicken pathogens, and human ‘influenza’ to which the CCP responded during this timeframe, also served as a diversion away from their activity in attempting to mitigate and understand a nascent viral (later named SARS-CoV-2) challenge.
13. Did the world exhibit blood antibody serum, CLI outbreak, or Covid-19 mRNA profiles which matched an exposure to Covid-19 prior to Oct 2019? Answer: Yes.
Sewage sampling and blood testing for serum antibodies even in Western nations such as Italy, France, and Barcelona, Spain, consistently showed mRNA or antibodies to Covid-19 which were generated as far back as January 2019. Given that it takes 10 months (Exhibit 2.2) for Covid to spread across the globe, this places a likely inception (true index case) in China, around March – June 2018.
To corroborate the Barcelona March 2019 mRNA detection (Exhibit 13.3) we note high excess death observations in Spain (Exhibits 6.4 and 6.5) – which place Covid in China around the Feb – May 2019 inception period. Both Barcelona, Spain as well as Lombardy, Italy are heavy Chinese citizen travel destinations. Accordingly, the Spain 4%, 11%, and 18% excess death data matches the 8%, 12%, and 26% excess death rates we observed in the over 85 cohort in Italy for 2018, 2019, and 2020 respectively (Exhibit 6.5). Something less virulent, but nonetheless still deadly swept through these first European regions to be hit with Covid up to a year before their supposed March 2020 outbreaks. These benchmarks corroborate the genetic analyses in Exhibits 7.4 and 7.5 well.
The U.S. blood donation antibody tests in particular demonstrated IgG antibodies in the population which were generated as far back as March 2019 in the United States alone (see Exhibit 13.2 below). In the chart immediately below (Exhibit 13.1), one can find all the studies cited inside this Question summarized onto one graphic. Each cited study then follows inside a set of actual study first page or critical images shown as Exhibits 13.2 through 13.12.
The chart below (Exhibit 13.1) falsifies the notion that SARS-CoV-2 appeared in China in December, or even October, 2019. It was present (in likely a less virulent or even precursor form) much earlier than those dates allow. Desperate attempts at debunking these detection points are underway, as they serve to falsify China’s CCP fairy tale – be cautious of such plausible deniability debunking efforts, and furthermore watch for the exercise of ‘outference’ (a method of pseudo-skepticism) as defined in Question #17 at the end of this article.

U.S. Blood Donation IgG Antibody study – March 2019

Barcelona Wastewater study Covid-19 mRNA – March 2019.
Please note that this study did not find just one detect, but two and from the same sample on the RdRp gene, primers IP2 and IP4 at 39 C(t). This was very unlikely to be a false positive given that there were two hits not just one, and furthermore RdRp primers are selected specifically to avoid cross-reactivity with the six other human-circulation coronavirus members (229E, OC43, SARS-CoV, NL63, HKU1, and MERS-CoV).63 While it is possible the detection was the result of contamination or sample mix-up, given the array of samples conducted with no contamination/mix-up false positives, this was also very unlikely. These plausible deniability spins constitute nothing more than simply a version of nulla infantis or ‘nuh-uh’ argument.
Therefore, one cannot just declare either of these as the conclusion nor even likely or implied conclusion. However, in a subsequent release the authors chose to leave the observation mute, because it was being exploited by China’s CCP as evidence that SARS-CoV-2 did not originate in China.64 The detection was not refuted, recanted, nor retracted – rather just left as an isolated observation. Fact-checkers agree with this neutral assessment.65 No effort has been made to confirm these results – so we have a case again, of Nelsonian inference being exploited to increase ignorance and imply ‘finished science’. Theories which get stronger as ignorance increases, are not theories at all. Do not trust people who make debunking claims based upon this common circumstance in scientific study.

Brazil Wastewater Study – November 2019

Oropharyngeal Swab Study from Milan, Italy – December 2019

Lung Cancer Blood Serum Antibodies in Pre-pandemic IgG Antibody Italy study – February 2019

India demonstrated a serum antibody rate of 60% in June 2021, despite only documenting Covid in a mere 2.1% of the population up to that time. Comparatively, it took the United States a full 18 months of exposure, just to get to a 38% seroprevalence. By deduction, India would have to have been exposed to a precursor of Covid, or Covid itself, a full 18 months prior to January 2020 – July 2018.

IgG Constances Cohort Antibody study from France – March 2019

VA Respiratory Illness Virginia Dept of Health – July 2019

Illinois Lung Injury Syndrome – April 2019

Wisconsin Pediatric Hospital Respiratory & Gastrointestinal Distress Syndrome Pneumonia with Glass Opacities – July 2019

SARS Antibodies in 50% of Population – National University of Singapore study – April 2020

14. Did China’s CCP attempt to conceal its gain-of-function activities, early case data, and genome libraries from the 2014 – 2019 period? Answer: Yes.
China’s CCP requested that 200 coronavirus samples submitted to the U.S. National Institutes of Health (NIH) be deleted in June of 2019. As it turned out, these sequences suggested that the virus was circulating in Wuhan earlier than previously thought, and could perhaps point toward answers on the origins of Sars-CoV-2 – answers that could not only help end this pandemic but prevent the next one. China’s CCP regarded its Party interests as being more important than global health however.
The Party Rule #3: There are no interests more important than the interests of The Party.

As well, China refused to submit samples from the first 174 cases of SARS-CoV-2 which it detected. These inception cases are critical in determining how diverse Covid mutation had been by the index case detection date. This would allow investigators to both affix an estimated actual inception date to the virus in China, and as well establish a likelihood of its inception being confined only to Wuhan. Thus, we must presume that by withholding these samples, China’s CCP is concealing data which could serve to falsify their narrative. This forces the earlier (before Oct 2019) outbreak hypothesis (the one favored by the House Minority Intelligence Committee, see Question #17) into becoming the null hypothesis. One must prove that Covid-19 miracle-mutated and appeared in Oct/Dec 2019, not simply assume it and then look for the evidence later.

15. Did China’s CCP appear to fudge its case and fatality measures regarding Covid, thereby obfuscating data indicating a much longer period of Covid exposure nationally? Answer: Yes.
Given that we know that lockdowns were not effective in quelling SARS-CoV-2 (Questions #1 through #6), we can infer that China’s report of cases (cited in green in Exhibit 15.1 below), were both mitigated by prior immunity, and as well were fabricated even given this reality. The sole purpose of this under-reporting was to ensure that the Chinese Communist Party did not appear weak before the international community. Targeted lockdowns had failed in China for 2 years, however now that the nation was seeing herd resistance at play, the CCP decided to exploit this natural phenomenon to make itself appear superior to the world. We observe here that the CCP’s intransigence with regard to its transparency is not merely motivated by a desire to not be mocked; but moreover, a desire to appear racially superior to their lesser-human planetary co-inhabitants. A formula we observed plied in the years immediately prior to World War II. A sentinel warning about what may also lie ahead for the world.
The Party Rule #4: Every decision on the part of The Party is both brilliant and correct.

Furthermore, in a display of how fudged the Chinese numbers were, the reduced case reporting shown in Exhibit 15.1 above served to artificially decrease the denominator in China’s advertised case fatality ratios (CFR’s) shown in Exhibit 15.2 below. As a result, China’s CCP gave the world a false depiction of Covid’s fatality rate at 4.15% (see the green trend y-axis intercept in Exhibit 15.2), sending most nations into overreaction. Not only was Covid ‘not like the flu’, apparently it was like Ebola. Accordingly, instead of preparing medical resources and treatment capabilities, panicked nations elected to pursue harmful lockdowns, feckless ‘zero-Covid’ impossibilities, and a slew of rushed vaccines. Flawed national policies were hastily enacted under this erroneous level of coerced panic and malicious actors exploited this in order to alter election laws towards The Party’s favor.

Patients were wrongly instructed by their doctors that
‘there is no treatment, go home and sleep it off’,
and as a result large numbers of people died of easily treatable
pneumonia, sepsis, and blood clots in their homes.66 67

Many people died from the ensuing shortfall in understanding, that Covid-19 did require treatment which was critical in avoiding death from secondary effects (warfarin, budesonide, doxycyline, apixaban, prednisone, etc.), as well as successful therapies for Covid-19 itself (ivermectin, monoclonal antibodies, hydroxycytidine, zinc, quercitin, vitamin D, etc.).
The Party Rule #5: Every action on the part of The Party is virtuous.

16. Did China’s CCP sabotage efforts to investigate SARS-CoV-2 and impose an obfuscating veil of intimidation around its origins and timing? Answer: Yes.
China falsely portrayed willingness to continue further investigation into the origins of SARS-CoV-2. But the reality was that this was under the condition that ‘lab leak’ was not one of the options under consideration to investigate. China delayed and terminated critical investigations, secured veto rights over critical participants, and clumsily tried to affix blame for SARS-CoV-2 upon other nations – especially the United States.


“It is beyond doubt that the CCP actively engaged in a cover-up designed to obfuscate data, hide relevant public health information, and suppress doctors and journalists who attempted to warn the world. They deliberately, and repeatedly, disregarded their obligations under the 2005 IHR. …As more countries have begun to question the CCP’s official accounting of the early stages of the pandemic and call for an international investigation, the PRC has used economic manipulation and trade coercion to demand silence.”
~ House Foreign Affairs Committee Minority Staff Report, 21 Sep 202168
China’s shutdown of travel within Wuhan, but abject allowance for travel from there to other nations, implies culpability on its part. It was only after US President Donald Trump petitioned directly to him on March 27th 2020, that Chinese President Xi Jinping finally agreed to curb international flights from Wuhan and China. Three months too late, and after a massive propaganda campaign on China’s part to dissuade nations from adopting travel clampdowns, only then did China finally call an end to this method of polluting the Covid-origins pool.69

Finally, how did China know to procure/equip/deploy trucks to spray atomized alcohol or bleach solutions into the atmosphere of the Wuhan streets in order to combat the virus, a mere four weeks after its very detection?70 Studies on the virus’ bacteriophage phases, fecal/wet protein aerosol transmission, and CAPE(S) associations were not conducted until months after pictures such as the one on the right were taken of Chinese mitigation efforts. Most track-and-trace minded global nations were puzzled by the apparent overkill in approach. But as we in the West gathered 15 intense months worth of knowledge about SARS-CoV-19, it became clear that the People’s Republic of China government held an intelligence base concerning SARS-CoV-2 in December 2019 that they did not offer up to the international community. Nor could they, as it would only serve to betray the charade. Their pandemic was in its third year and final phase – immunity was widespread. The rest of the world was fucked, and it was not the CCP’s problem.
As we noted in Question #2 above, this relatively advanced early knowledge regarding SARS-CoV-2 on the part of the CCP, and their adept grasp of exactly what was needed in order to obfuscate origin issues, is called Nelsonian Knowledge. It betrays a deep a priori experiential knowledge of Covid-19 and its particulars on the part of China’s CCP – a knowledge they should not have possessed, if indeed this was a 27 Dec 2019 ‘novel pneumonia’.

The notion that SARS-CoV-2 originated from a gigantic genetic/furin cleavage zoonotic jump event in a seafood wet market in December 2019, and then underwent 18 months of variant mutations and spread to 95% of global nations in the next 70 days, and that the Chinese just withhold critical information because that is just what Chinese do, it’s their thing – is not only racist, but scientifically gullible.
The Party Rule #6: The narrative is the truth.
17. Did various nation’s/intelligence agencies agree with the above assessment on the part of The Ethical Skeptic? Answer: Yes (mostly), and No.
Of course we reviewed the assessment by the House Foreign Affairs Committee Minority Staff Report of 21 Sep 2021 in Question #16 above. They cite an obvious campaign of coverup and intimidation on the part of the CCP. However, let’s continue on with reports from the intelligence community itself. Two reports in particular came out in August and October of 2021. Their conclusions are outlined below.
“It is the opinion of Committee Minority Staff, based on the preponderance of available information; the documented efforts to obfuscate, hide, and destroy evidence; and the lack of physical evidence to the contrary; that SARS-CoV-2 was accidentally released from a Wuhan Institute of Virology laboratory sometime prior to September 12, 2019. [Note that the HICMS does not agree with the Easter Egg (a planted discovery waiting to be found) ‘October Surprise’ theory.]
The virus …was likely collected in the identified cave in Yunnan Province, PRC, sometime between 2012 and 2015. Its release was due to poor lab safety standards and practices, exacerbated by dangerous gain-of-function research being conducted at inadequate biosafety levels…”
~ House Intelligence Committee Minority Staff Report, August 2021


However the Office of the Director of National Intelligence shied away from taking the recommendation of the House Committee in its unclassified Update Assessment of October 2021. Its constituents officially ‘remained divided’ (politics?) on the issue of lab versus zoonotic origin, and did not hold enough real information to conjecture further.71
Outference – a critical (not rhetorical) argument which bases its inference or conclusions upon cultivated ignorance and the resulting lack of information, rather than the presence of sound information. More than simply an appeal to ignorance, this ‘lack’ of information is specifically engineered to produce specious conclusion in the first place. This type of argument gets stronger and stronger the less and less critical information one holds. This is a warning flag of agenda or political shenanigans at play.
Keep that critical definition in mind when reviewing the following ODNI Update Assessment summary:
- “The IC assesses that SARS-CoV-2, the virus that causes COVID-19, probably emerged and infected humans through an initial small-scale exposure that occurred no later than November 2019 with the first known cluster of COVID-19 cases arising in Wuhan, China in December 2019.”
Agrees with our assessment but really means nothing. Is a ‘the sky is some color between red and violet’ statement. - “Most agencies also assess with low confidence that SARS-CoV-2 probably was not genetically engineered; however, two agencies believe there was not sufficient evidence to make an assessment either way.”
Neutral. Disagrees with our assessment at face value, but is a rhetorical argument and implies nothing of a critical path nature. Merely symbolic. - “Finally, the IC assesses China’s officials did not have foreknowledge of the virus before the initial outbreak of COVID-19 emerged.”
Disagrees with our conclusion, but bases this inference on a lack of, rather than a presence of information. A lack of information specifically engineered by China’s CCP. - “After examining all available intelligence reporting and other information, though, the IC remains divided on the most likely origin of COVID-19. All agencies assess that two hypotheses are plausible: natural exposure to an infected animal and a laboratory-associated incident.”
Neutral and implies nothing. - “One IC element assesses with ‘moderate confidence’ that the first human infection with SARS-CoV-2 most likely was the result of a laboratory-associated incident, probably involving experimentation, animal handling, or sampling by the Wuhan Institute of Virology.”
Agrees with our assessment but offers no evidence nor critical argument. - “The IC—and the global scientific community—lacks clinical samples or a complete understanding of epidemiological data from the earliest COVID-19 cases. If we obtain information on the earliest cases that identified a location of interest or occupational exposure, it may alter our evaluation of hypotheses.”
Neutral – essentially saying that they do not really know much. - China’s cooperation most likely would be needed to reach a conclusive assessment of the origins of COVID-19. Beijing, however, continues to hinder the global investigation, resist sharing information, and blame other countries, including the United States.
Agrees. The strongest critical argument of the report.
One cannot contend a conclusion nor a confidence level on that conclusion, and thereafter cite that they are not getting the data they need in order to make a conclusion in the first place. Such cultivated ignorance and the theories which result from its outference, merely serve as political-fear narratives protecting their issuers from The Party’s compliance patrols.
The mistakes outlined above, along with the conjecture as to who bears responsibility for them, therefore do not constitute a conspiracy theory. They were enacted on the part of a Chinese Communist Party which wholly underestimated the level of program rigor and operational discipline required to manage and control a potential bio-weapon. They further then mistakenly launched this weapon upon a planet-load of innocent civilians. Finally, like any mafia they followed up their crime with an utter disregard for ethics, humanity, and any semblance of accountability.
The Party Rule #7: In the end, only The Party is of any importance.
If China’s CCP is willing to conduct this level of surreptitious harm to the rest of the world over a matter of a virus escape, then what will The Party be willing to do to the rest of the world when they are really upset? The Chinese Communist Party owes the international community recompense for the massive levels of death, economic disruption, and suffering of our loved ones.

The Ethical Skeptic, “China’s CCP Concealed SARS-CoV-2 Presence in China as Far Back as March 2018”; The Ethical Skeptic, WordPress, 15 Nov 2021 (Rev 1.2, 2 Dec 2021); Web, https://theethicalskeptic.com/?p=54800
- Wikipedia: Iran Air Flight 655; https://en.wikipedia.org/wiki/Iran_Air_Flight_655
- Mention should be made here providing clarity as to the contrast between accusation against a presiding Party, versus the people over whom they hold authority. This accusation is against the Chinese Communist Party, and does not constitute in any way a disparagement of the Chinese people, nor people of Chinese ethnic descent living abroad.
- Kuchipudi, et al;bioRxiv preprint; Multiple spillovers and onward transmission of SARS-CoV-2 in free-living and captive white-tailed deer; 6 Nov 2021; https://www.biorxiv.org/content/10.1101/2021.10.31.466677v2.full
- John Hayward; Breitbart: China’s Latest Fearmongering: American Deer May Spread Coronavirus; 5 Aug 2021; https://www.breitbart.com/health/2021/08/05/chinas-latest-fearmongering-american-deer-may-spread-coronavirus/
- Bashir Adelodun, Pankaj Kumar, Golden Odey, Fidelis Odedishemi Ajibade, Rahmat Gbemisola Ibrahim, Saad A.M. Alamri, Sulaiman A. Alrumman, Ebrahem M. Eid, Vinod Kumar, Khalid Adeola Adeyemi, Ashish Kumar Arya, Archana Bachheti, Marcos L.S. Oliveira, Kyung Sook Choi, A safe haven of SARS-CoV-2 in the environment: Prevalence and potential transmission risks in the effluent, sludge, and biosolids, Geoscience Frontiers, 2022,101373, ISSN 1674-9871, https://doi.org/10.1016/j.gsf.2022.101373.
- Wikipedia: Convective available potential energy; https://en.wikipedia.org/wiki/Convective_available_potential_energy
- Convective Available Potential Energy from Surface: Orthographic Overlay; https://earth.nullschool.net/#current/wind/isobaric/1000hPa/overlay=cape/orthographic=-99.51,38.22,1015
- MacIntyre CR, Das A, Chen X, Silva CD, Doolan C. Evidence of Long-Distance Aerial Convection of Variola Virus and Implications for Disease Control. Viruses. 2020; 12(1):33. https://doi.org/10.3390/v12010033
- Lei, Zu, et al; “Infection risk of household contacts is 10 times higher than other contacts.”; Household transmission of COVID-19-a systematic review and meta-analysis; 25 Aug 2020; https://www.ncbi.nlm.nih.gov/pmc/articles/PMC7446647/
- CDC Newsroom : Statement from CDC Director Rochelle P. Walensky, MD, MPH on Today’s MMWR; 30 Jul 2021; https://www.cdc.gov/media/releases/2021/s0730-mmwr-covid-19.html
- Rice University’s Baker Institute for Public Policy; Report on State Restrictions versus Covid Death Rates; https://www.bakerinstitute.org/files/16706/
- Monto, DeJonge, et al; Coronavirus Occurrence and Transmission Over 8 Years in the HIVE Cohort of Households in MichiganThe Journal of Infectious Diseases, Volume 222, Issue 1, 1 July 2020, Pages 9–16, https://doi.org/10.1093/infdis/jiaa161
- The Ethical Skeptic, “The Elements of Hypothesis”; The Ethical Skeptic, WordPress, 4 Mar 2019; Web, https://wp.me/p17q0e-94J
- “Spread of “Asian Influenza” (H2N2), 1957″ from Impact of Pandemic Influenza on Public Health. Available at: http://ocw.jhsph.edu. Copyright © Johns Hopkins Bloomberg School of Public Health. Creative Commons BY-NC-SA.
- Superantigenic character of an insert unique to SARS-CoV-2 spike supported by skewed TCR repertoire in patients with hyperinflammation Mary Hongying Cheng, She Zhang, Rebecca A. Porritt, Magali Noval Rivas, Lisa Paschold, Edith Willscher, Mascha Binder, Moshe Arditi, Ivet Bahar Proceedings of the National Academy of Sciences Oct 2020, 117 (41) 25254-25262; DOI: 10.1073/pnas.2010722117
- WorldoMeter: “Deaths per 1 Million Population, World”; https://www.worldometers.info/coronavirus/#countries
- WorldoMeter: “Deaths per 1 Million Population, World”; https://www.worldometers.info/coronavirus/#countries
- Borrega R, Nelson DKS, Koval AP, Bond NG, Heinrich ML, Rowland MM, Lathigra R, Bush DJ, Aimukanova I, Phinney WN, Koval SA, Hoffmann AR, Smither AR, Bell-Kareem AR, Melnik LI, Genemaras KJ, Chao K, Snarski P, Melton AB, Harrell JE, Smira AA, Elliott DH, Rouelle JA, Sabino-Santos G Jr., Drouin AC, Momoh M, Sandi JD, Goba A, Samuels RJ, Kanneh L, Gbakie M, Branco ZL, Shaffer JG, Schieffelin JS, Robinson JE, Fusco DN, Sabeti PC, Andersen KG, Grant DS, Boisen ML, Branco LM, Garry RF. Cross-Reactive Antibodies to SARS-CoV-2 and MERS-CoV in Pre-COVID-19 Blood Samples from Sierra Leoneans. Viruses. 2021; 13(11):2325. https://doi.org/10.3390/v13112325
- Anderson, E.M.; Goodwin, E.C.; Verma, A.; Arevalo, C.P.; Bolton, M.J.; Weirick, M.E.; Gouma, S.; McAllister, C.M.; Christensen, S.R.; Weaver, J.; et al. Seasonal human coronavirus antibodies are boosted upon SARS-CoV-2 infection but not associated with protection. Cell 2021, 184, 1858–1864.e10
- Poston, D.; Weisblum, Y.; Wise, H.; Templeton, K.; Jenks, S.; Hatziioannou, T.; Bieniasz, P. Absence of Severe Acute Respiratory Syndrome Coronavirus 2 Neutralizing Activity in Prepandemic Sera From Individuals With Recent Seasonal Coronavirus Infection. Clin. Infect. Dis. 2021, 73, e1208–e1211
- Pyankov OV, Bodnev SA, Pyankova OG, Agranovski IE. Survival of aerosolized coronavirus in the ambient air. J Aerosol Sci. 2018 Jan;115:158-163. doi: 10.1016/j.jaerosci.2017.09.009. Epub 2017 Sep 7. PMID: 32226116; PMCID: PMC7094304.
- University of Berkeley, Max Planck Institute: Human Mortality Database: STMF Visualization Toolkit – Excess Deaths, Ages 85+, 2015-2020, 6 May 2021; https://www.mortality.org/
- Boni, Lemey, et al; Evolutionary origins of the SARS-CoV-2 sarbecovirus lineage responsible for the COVID-19 pandemic; Nov 2020; https://pubmed.ncbi.nlm.nih.gov/32724171/
- Evolutionary Distance of SARS-CoV-2 and Bat Coronaviruses Studied Under the NIH-
supported Research Grant to EcoHealth Alliance; https://republicans-energycommerce.house.gov/wp-content/uploads/2021/10/Analysis-Distance-between-SARS-CoV-2-and-studied-bat-viruses-10.18.2021-V5-Updated-Image.pdf - December 14th, 2021; Evidence for a mouse origin of the SARS-CoV-2 Omicron variant; Changshuo Wei, Ke-Jia Shan, Weiguang Wang, Shuya Zhang, Qing Huan,, and Wenfeng Qian; State Key Laboratory of Plant Genomics, Institute of Genetics and Developmental Biology, Innovation Academy for Seed Design, Chinese Academy of Sciences, Beijing 100101, China8; University of Chinese Academy of Sciences, Beijing 100049, China
- https://archive.md/OIGPz#selection-905.1-929.120
- Yongsen Ruan, Haijun Wen, Mei Hou, Ziwen He, Xuemei Lu, Yongbiao Xue, Xionglei He, Ya-Ping Zhang, Chung-I Wu, The twin-beginnings of COVID-19 in Asia and Europe – One prevails quickly, National Science Review, 2021;, nwab223, https://doi.org/10.1093/nsr/nwab223
- Ivan Aksamentov, Cornelius Roemer, Emma B Hodcroft, & Richard A Neher. (2021). Nextclade: clade assignment, mutation calling and quality control for viral genomes. https://doi.org/10.5281/zenodo.5607694
- Nextstrain: Genomic epidemiology of novel coronavirus – Global subsampling; https://nextstrain.org/ncov/gisaid/global?l=scatter
- Alaa Abdel Latif, Julia L. Mullen, Manar Alkuzweny, Ginger Tsueng, Marco Cano, Emily Haag, Jerry Zhou, Mark Zeller, Emory Hufbauer, Nate Matteson, Chunlei Wu, Kristian G. Andersen, Andrew I. Su, Karthik Gangavarapu, Laura D. Hughes, and the Center for Viral Systems Biology. outbreak.info, (available at https://outbreak.info/compare-lineages?pango=Omicron). Accessed 6 December 2021.
- Ivan Aksamentov, Cornelius Roemer, Emma B Hodcroft, & Richard A Neher. (2021). Nextclade: clade assignment, mutation calling and quality control for viral genomes. https://doi.org/10.5281/zenodo.5607694
- Venkatakrishnan, AJ, et al. “Omicron Variant of Sars-cov-2 Harbors a Unique Insertion Mutation of Putative Viral or Human Genomic Origin.” OSF Preprints, Web. 3 Dec 2021
- Nextstrain: Genomic epidemiology of novel coronavirus – Global subsampling; https://nextstrain.org/ncov/gisaid/global?l=scatter
- B. Bakhshandeh, Z. Jahanafrooz, et al; May 2021; Mutations in SARS-CoV-2; Consequences in structure, function, and pathogenicity of the virus; https://www.ncbi.nlm.nih.gov/pmc/articles/PMC7955574/
- “Analyses of subsequent data sets, that included between 47 and 122 genomes, converged at an evolutionary rate of about 1.1 × 10⁻³ subs/site/year and a time of origin of around late November 2019″; Sebastian Duchene, Leo Featherstone, Melina Haritopoulou-Sinanidou, Andrew Rambaut, Philippe Lemey, Guy Baele, Temporal signal and the phylodynamic threshold of SARS-CoV-2, Virus Evolution, Volume 6, Issue 2, July 2020; https://doi.org/10.1093/ve/veaa061
- “Covid raw mutation rates are higher than the actual rate of appearance of mutations in the circulating population.”; Atahualpa Castillo Morales, Alan M Rice, Alexander T Ho, Christine Mordstein, Stefanie Mühlhausen, Samir Watson, Laura Cano, Bethan Young, Grzegorz Kudla, Laurence D Hurst, Causes and Consequences of Purifying Selection on SARS-CoV-2, Genome Biology and Evolution, Volume 13, Issue 10, October 2021, evab196, https://doi.org/10.1093/gbe/evab196
- Nextstrain: Genomic epidemiology of novel coronavirus – Global subsampling; https://nextstrain.org/ncov/gisaid/global?l=scatter
- Wikipedia: SARS-CoV-2 Omicron variant; https://en.wikipedia.org/wiki/SARS-CoV-2_Omicron_variant
- Raskin, Salmo. “Genetics of COVID-19.” Jornal de pediatria vol. 97,4 (2021): 378-386. doi:10.1016/j.jped.2020.09.002
- Ivan Aksamentov, Cornelius Roemer, Emma B Hodcroft, & Richard A Neher. (2021). Nextclade: clade assignment, mutation calling and quality control for viral genomes. https://doi.org/10.5281/zenodo.5607694
- Sanjuan, Nebot, et al; Viral Mutation Rates; Journ of Virology; Jul 2010; https://www.ncbi.nlm.nih.gov/pmc/articles/PMC2937809/
- Our source studies on mutation rates do not provide confidence intervals, standard deviations, nor relevant ranges, so we must choose the lower bound of conservancy in each case to address uncertainty, and not run fictitious statistical distributions in order to appear ‘sciencey’ – this is detective work, not a school lab project. If one insists that this estimate be bounded for confidence, then my guesstimate for a 95% CI is 8.65 years ±2.314 (±26.8%) [6.336 – 10.964] – wherein we have chosen 6.1 in a range of 6.336 – 10.964 – indicative of the level of conservancy applied in this estimate.
- Zhao, Li, et al; Moderate mutation rate in the SARS[-CoV-1] coronavirus genome and its implications; BMC Evol Biol.; Apr 2004; https://www.ncbi.nlm.nih.gov/pmc/articles/PMC446188/
- “The mutation rate for the NK strain [FCS] was calculated as 0.3 (change in mutation frequency/day).”; SARS-CoV-2 Quasispecies Mediate Rapid Virus Evolution and Adaptation M. Zeeshan Chaudhry, Kathrin Eschke, Martina Grashoff, Leila Abassi, Yeonsu Kim, Linda Brunotte, Stephan Ludwig, Željka Mačak Šafranko, Ivan-Christian Kurolt, Alemka Markotić, Andrea Kröger, Frank Klawonn, Luka Cicin-Sain bioRxiv 2020.08.10.241414; doi: https://doi.org/10.1101/2020.08.10.241414
- Nextstrain: Genomic epidemiology of novel coronavirus – Global subsampling; https://nextstrain.org/ncov/gisaid/global?l=scatter
- Kandeel M, Mohamed MEM, Abd El-Lateef HM, Venugopala KN, El-Beltagi HS. Omicron variant genome evolution and phylogenetics. J Med Virol. 2021 Dec 10. doi: 10.1002/jmv.27515. Epub ahead of print. PMID: 34888894.
- Nextstrain: Genomic epidemiology of novel coronavirus – Global subsampling; https://nextstrain.org/ncov/gisaid/global?l=scatter
- Nextstrain: Genomic epidemiology of novel coronavirus – Global subsampling; https://nextstrain.org/ncov/gisaid/global?l=scatter
- Covid CG – Covid Genetics: GISAID Lineage Reports by Nucleotide; 6 Dec 2021; https://covidcg.org/?tab=report
- Nextstrain: Genomic epidemiology of novel coronavirus – Global subsampling; https://nextstrain.org/ncov/gisaid/global?l=scatter
- A ‘spanning tree’ is an analytical tool used in industrial engineering to optimize networks or processes by a set of nodes and the spans of distance in between them. See here. In this application the tree is assembled in very much the same manner as is a fix in celestial navigation, by finding the intersection of the ‘entropy-weighted distances’ (spans) between variants (nodes).
- Pascall DJ, Nomikou K, Bréard E, Zientara S, Filipe AdS, Hoffmann B, et al. (2020) “Frozen evolution” of an RNA virus suggests accidental release as a potential cause of arbovirus re-emergence. PLoS Biol 18(4): e3000673. https://doi.org/10.1371/journal.pbio.3000673
- Kandeel, Beltagi, et al.; Omicron variant genome evolution and phylogenetics, 14 Dec 2021; https://onlinelibrary.wiley.com/doi/epdf/10.1002/jmv.27515
- Lam TT, Jia N, Zhang YW, Shum MH, Jiang JF, Zhu HC, Tong YG, Shi YX, Ni XB, Liao YS, Li WJ, Jiang BG, Wei W, Yuan TT, Zheng K, Cui XM, Li J, Pei GQ, Qiang X, Cheung WY, Li LF, Sun FF, Qin S, Huang JC, Leung GM, Holmes EC, Hu YL, Guan Y, Cao WC. Identifying SARS-CoV-2-related coronaviruses in Malayan pangolins. Nature. 2020 Jul;583(7815):282-285. doi: 10.1038/s41586-020-2169-0. Epub 2020 Mar 26. PMID: 32218527.
- Koyama, Takahiko & Platt, Daniel & Parida, Laxmi. (2020). Variant analysis of COVID-19 genomes. Bulletin of the World Health Organization. 98. 10.2471/BLT.20.253591.
- Nextstrain: Genomic epidemiology of novel coronavirus – Global subsampling; https://nextstrain.org/ncov/gisaid/global?l=scatter
- Omicron : the molecular analysis of Pr. Jacques Fantini; 28 Nov 2021; https://frenchdailynews.com/health/3691-omicron-the-molecular-analysis-of-pr-jacques-fantini
- Karen Kaplan, Los Angeles Times: A timeline of COVID-19’s first weeks in Wuhan; 18 Nov 2021; https://news.yahoo.com/timeline-covid-19s-first-weeks-212442547.html
- Tao D, Sun D, Liu Y, Wei S, Yang Z, An T, Shan F, Chen Z, Liu J. One year of African swine fever outbreak in China. Acta Trop. 2020 Nov;211:105602. doi: 10.1016/j.actatropica.2020.105602. Epub 2020 Jun 26. PMID: 32598922.
- Grady McGregor; Fortune: China is getting its pig epidemic under control, but it’s not out of the woods yet; 3 Jul 2021; https://fortune.com/2021/07/03/african-swine-fever-epidemic-china-pig-recovery/
- Port Report: China sees decent growth in container volumes for the first quarter 2019; 2 May 2019; https://www.freightwaves.com/news/maritime/port-report-china-container-volumes-first-quarter
- Did Trump’s tariffs benefit American workers and national security?; 10 Sep 2020; https://www.brookings.edu/policy2020/votervital/did-trumps-tariffs-benefit-american-workers-and-national-security/
- Table 2; Giri, Pandey, et al; Review of analytical performance of COVID-19 detection methods; 18 Sep 2020; https://www.ncbi.nlm.nih.gov/pmc/articles/PMC7498299/
- Ed Southgate; China blames SPAIN for coronavirus suggesting Covid-19 originated in Europe and not in Wuhan; 4 Jul 2020; https://www.thesun.co.uk/news/12028909/china-blames-spain-for-coronavirus/
- Mariam Fauzia; USA Today Fact check: Researchers found coronavirus in March 2019 wastewater; more study needed; 7 Jul 2020; https://www.usatoday.com/story/news/factcheck/2020/07/07/fact-check-coronavirus-found-march-2019-wastewater-sample/5350878002/
- Colin Perkel; Canadian Press; Rise in sudden COVID-19 deaths at home still a mystery, Ontario chief coroner says; 23 Apr 2021; https://globalnews.ca/news/7784320/rise-in-sudden-covid-deaths-at-home-ontario/
- The increase in Deaths in the Home Setting: ONS Update;18 Aug 2020 https://www.cebm.net/covid-19/the-increase-in-deaths-in-the-home-setting-ons-death-data-update/
- House Foreign Affairs Committee Minority Staff; Final Report: THE ORIGINS OF THE COVID-19 GLOBAL PANDEMIC, INCLUDING THE ROLES OF THE CHINESE COMMUNIST PARTY AND THE WORLD HEALTH ORGANIZATION; 21 Sep 2021; https://gop-foreignaffairs.house.gov/wp-content/uploads/2020/09/Final-Minority-Report-on-the-Origins-of-the-COVID-19-Global-Pandemic-Including-the-Roles-of-the-CCP-and-WHO-9.20.20-Coverpage.pdf
- Sandip Sen; The Economic Times: How China locked down internally for COVID-19, but pushed foreign travel; 30 Apr 2020; https://economictimes.indiatimes.com/blogs/Whathappensif/how-china-locked-down-internally-for-covid-19-but-pushed-foreign-travel/
- Daniel Kucher; Somag News: Images Resembling Movie Scenes From Wuhan Disinfected With Trucks; 11 Feb 2020; https://www.somagnews.com/images-resembling-movie-scenes-wuhan-disinfected-trucks/
- Office of the Director of National Intelligence – National Intelligence Council; Update Assessment on Covid-19 Origins; Oct 2021; https://www.dni.gov/files/ODNI/documents/assessments/Declassified-Assessment-on-COVID-19-Origins.pdf
[…] think that SARS-COV-2 virus was already in the wild as early as 2018. See also (1), […]
Another great article, TES. I don’t know how you find the time to compile and analyze so much information. Thank you.
Forgive me if I missed this, but what gives you confidence that the virus was not released intentionally? It seems that the origin debate stops shy of determining intent. It seems highly plausible, if not likely, to me that this was an intentional act. Thanks.
Thanks Casey, I suspect that several viruses were released from a PLA shadow-mirror lab in mid 2017, which was established as new along with these new public labs. They took a much more cavalier approach to biosafety lab protocols. We were hit with many viruses, not just Wuhan. Pig and chickens died in 2018 from new viruses which killed 60% and 25% of those stock herds in China. Rather curious coincidental timing. Omicron was not the same virus as Wuhan. The PLA’s arrogance, power, and xenophobia, established it as ‘disrespectful’ of most of humanity as animals-infidels-slaves, not in need of… Read more »
Brilliant article. Recently, there has been a widespread appeal in Japan by a certain scientist who is obsessed with the hypothesis of a rapid mutation of the Omicron strain. I felt a bit strange about it, so I surfed the net a bit and came across your site. May I introduce your article on Japanese video websites? I am concerned about the spread of bad conspiracy theories because there are few people like you who can take a correct skeptic view. There are very few people who can think in an organized way about the virus being of lab origin,… Read more »
Ethical Skeptic, have you seen these documents?
https://docs.google.com/document/u/1/d/e/2PACX-1vTQxG822DtqP7IZSjLj751Mrm8Ev7leksXfjBLsA9KJ0_tbGV6YJAAjuijPnwz_YmUQGY1PZUl5LcCI/pub
Why do you think that China put large swathes of the country back into ruthless lockdowns in 2022, is they had nationwide immunity?
They are on their second round. How do you think the current four Human Coronaviruses have survived to give everyone the cold every 2 to 3 years? They mutate, adapt to our antibodies, and our antibodies fade – and we have to do it all over again. This is an ACAN problem, and requires more than linear thinking. Covid will return to us as well, just hopefully mutated heavily and a lot less dangerous.
TES
Thank you for your reply. That was already my thinking, but just wanted to see if you agreed.
It also seems to me that this will be their justification for continual annual covid vaccines to earn them a lot more money.
Great article
Covid was in Pensacola mothers day 2019. I think it was here in the “late” flu surge feb 2018. They put the covid vax in the Fall 2017 flu shots, with lot numbers and social security nubers linked. they “discovered” only 9% efficacy of those lot numbers. they also knew who and how many perished after those “flu” lots were given, and the dose levels of those lots. so, They knew the expected results when april 2021 rollout started. This is not incompetence since april 2021. it is their plan.
Seems like a good article,but lacks life links for proof of,in my eye’s!
Asia is clearly the “weak” point of the narrative, since day 1. I know, I live in… Bangkok (Thailand). Thailand was the first country to officially announce a Covid case outside China (january 7 2020). In january 2020, more than 800 000 chinese tourists came in Thailand ! I remember, we had SEVERAL flights Wuhan->Bangkok PER DAY ! And ? As you pointed you : nothing. Nothing happened (from a public health point of view). The whole year ! Actually, cases started to appear in South East Asia… in april 2021… when they began the “vaccination”, but that’s another debate.… Read more »
Brilliant, prescient, directly observed. Love it Chris.
TES
kill in a flash… i saw those videos. didnt make sense til now. Those videos were Vaxxine deaths. Not covid as suggested. looks just like all the current vax death videos. China was doing as it was told ordered to do. they are patsies. The vaxxine is a self spreading airborne vaxine. and the nano lipids also release the new self spreading variants 41 days after the shot. every variant came out of the shots and boosters. delta omi ba5… now ba6.
A tour de force of exemplary research Ethical Skeptic. I am in complete agreement with the proposed time frame. Both myself and my partner were critically injured before the announcement of the supposed Covid Crisis. We were both hospitalized with life threatening blood and lung conditions which IMOP could not have been anything other than Covid 19. In both cases it took over a week in the hospital before we were allowed to return home.
I am so glad you made it out alive gambeir. The hospitals did not know to treat this as a thromboembolic and endothelial inflammation disease. Many people died from lack of treatment outside the hospital (or even in the hospital).
TES
I wish someone could do studies of early covid presence in Davis, CA. My son and his girlfriend were at UC Davis there in the fall of 2019. In October or so, a “flu” was going around. My son and GF got it in November, and both were fairly sick as respiratory illnesses go. The GF has asthma and she was worse off than he was. At one point she had to go to the ER and get a nebulizer to help her….I believe it delivered steroids to her lungs. She was also given….wait for this….Ivermectin. She was pretty sick… Read more »
In late May 2019, my wife and I visited Naples, Italy. The owner of our rented apartment was Chinese and was recovering (she said) from the ‘flu. She had recently returned from visiting family in China. A few days later, I became ill and suffered what is now called ‘Covid 19’. The severe phase lasted about five days, during which I was bedridden and virtually drowning in my own mucus. This was followed by two weeks of coughing and general malaise. I now believe that it was Covid, brought to Italy by my Chinese host – in 2019.
https://www.jenniferzengblog.com/home/flying-hiv
maybe even earlier, is this it?
Thank you for the considered reply to my 2 questions. I appreciate your thought-provoking and detailed response. I am hoping that you will find time to address a couple of additional questions which might help me and others understand the timeframe as to when the first White-tailed Deer could possibly have contracted Covid-19 anywhere within the United States. I have read elsewhere a belief that the SARS-CoV-2 virus may have been circulating in the US long before it was detected on January 18, 2020 in the State of Washington; this first documented case of Covid-19 was found in an individual… Read more »
Dan, As I like to frame the context of questions, your is ‘salient, sequitur, and critical path’. I would love to have the answer to this. I can only address it abductively (best guess of likeliness) – so this does not make it but one idea. The 2018 ancestor of Covid, which conferred immunity, did not hit the US hard. It ended its Hope-Simpson season and went mostly extinct before it really penetrated 35 final nations well. In similar fashion to Delta, which did the same thing. I think that SARS-CoV-2 virus loads probably did not rise to the level… Read more »
I read with great interest your discussion of sewage sludge as a possible means for the spread of Covid-19 among White-tailed Deer, and wondered what evidence you may have found which addresses the likelihood that live virus could persist with sufficient viability in this medium to cause infection if subsequently contacted or inhaled when aerosolized. My preliminary investigation into studies and other research which may bear on this question led me to conclude that the viability of live viruses would be exceedingly low and thus unlikely to persist in sewage “sludge” – particularly if it was “digested” or “activated” as is… Read more »
Dan, Regarding question 1 ‘Can a live virus survive long in sewage sludge?’ – Covid is not a lone virus in sewage. It is not exposed to oxygen, halogens, or UV when in sludge – and more importantly, it acts like a bacteriophage – especially with dysbiosis constituents, Coprobacillus, Clostridium ramosum and Clostridium hathewayi, etc. It lives inside intestinal bacteria – and will stay alive as long as there are remnants of ACE2/MAS/G protein pathways, There is a reason why sewage sludge can only be used in the Fall, prior to the first freeze. Class B Biosolids are ‘mostly mitigated’… Read more »
Perhaps the Wuhan lab employed one or more careless technicians causing multiple virus leaks over the years, with different variations of the virus each time. This could explain why an early mild variant could have spread in 2018 and not have been recognized as a Wuhan leak, and the recent more virulent strain caused conspicuous disease in Wuhan before it spread elsewhere. I was quite suspicious at the beginning as to how Moderna could have gotten the full viral sequence so soon after the illness made headlines around December 2019, unless the Wuhan lab had the full sequence, gave it… Read more »
Not a bad scenario plausibly explaining the genetic diversity. This I will keep in mind.
Thanks Kev
TES
June 2021 cases curves from Latvia Estonia Australia “you wouldn’t believe the truth”… Hmmm… I keep saying Delta came from the Vax. Georgia got same delta hit as Latvia, Estonia, and Australia… And Delta is also symbol of change… The purpose was to change the minds of the younger and healthier… Delta killed my coworkers younger sons coworker. 2 of my coworkers age 32? and 42? Hospitalized by Delta. Our circle, N = 1500 last summer was mostly younger Delta cases. MIT article on multiple vaccine doses delivered by polymer encapsulates in nano cups that can release 41 days later…… Read more »
Hi TES,
Is is possible that omicron is much more mild relative to previous variants because it no longer has the section that resembles staphylococcal enterotoxin B? The most recent article I could find is this one https://www.cell.com/structure/fulltext/S0969-2126(21)00121-0?_returnURL=https%3A%2F%2Flinkinghub.elsevier.com%2Fretrieve%2Fpii%2FS0969212621001210%3Fshowall%3Dtrue
Regards,
AQ
Apologies, I missed the brief sentence where you already mentioned this, there’s no option to delete the redundant comment. Have you tried to get a journalist to publish your findings? I’m surprised by the lack of media coverage on the staphylococcal enterotoxin B superantigen section of SARS-COV-2, though I guess with most countries being economically dependent on China this is would ruffle too many feathers.
I see an odd coincidence in your “Zone I” map: Venezuela is in Zone I even though its neighbors are in Zone III. Cuba is also in Zone I, alone in the Zone II Caribbean. Two-thirds of the Zone I countries in and near the Americas are Communist countries. Why would a country’s governing ideology have any effect on whether its population has prior immunity to a virus, unless there was human action taken to make it that way?
See Exhibit 5.2 and think through this. ;-)
Hello, I shared this webpage with a professional biology server and someone had the following comments: To pick a random example: “If those weighted contrast strengths are then summed as a total for 144 nucleotide sites, and shown as vectors on a spanning tree diagram (see upper right of Exhibit 7.11), they can be optimized into a single configuration of nodes (optimized spanning tree).47” In other words, if I force all the variants to stem from one source the result is a single tree I’m saying the ideas do not follow from each other It’s not coherent Why only deer… Read more »
In other words, if I force all the variants to stem from one source the result is a single tree. I’m saying the ideas do not follow from each other It’s not coherent Yes, Covid evolved independently, twice in the same exact year, from the same exact BANAL-52/20 source in Laos. 🙄 This is not just wrong it is not even wrong. The person can pass off bad genetics theory to the average layman, but not me. If they are implying Covid was lab generated then of course anything goes. Why only deer in the Midwest? Because the study was… Read more »
Could you please briefly address this genomics comment: “this a conspiracy theory at the opposite end.The odds of zoonotic emergence at two separate geographically separate locations at the almost the exact same time is nearly nil. https://www.researchgate.net/publication/355136936_The_twin-beginnings_of_COVID-19_in_Asia_and_Europe_-_One_prevails_quickly China is pushing heavily the narrative that SARS-COV-2 originated from elsewhere such as the US or Europe to shift blame. This research paper is interestingly written by one person only from a Chinese University. Then again I should probably look into the genomics myself – quite time consuming though. I asked if it was possible that SARS-COV-2 origins could date back to 2018 in… Read more »
Gotcha AQ… Given the immunity taper curve (Exhibit 4.5), the new King George’s Island strains of Covid which were found in 2018 soil samples, and the fact that China hid all databases on prior variants, the likelihood that the virus was released anywhere other than China is nil (as they say). Now the research may have kicked off as a viral strain in the US in 2014… but this was from a Loas Bat virus BANAL-52 and 20 – on BLASTn searches, but highly modified with a furin cleavage and exact previous IP from other viruses. So it is 100%… Read more »
I’ve read we, USA can hack computers and databases, and leave fingerprints of our enemies. “100% – in China” is the same kind of fingerprint that adds levels of Plausible Deniability. 2014… or way before… When I asked Military Intel customer who returned from there… What really happened over there??? “I cant tell you, but I can tell you, WE GOT WHAT WE NEEDED”… Didn’t make sense… unless one thinks we were studying the spread of more communicable variant… and or the use of a treatment or vaccine. SARS and MERS were trial runs…
Can’t see how the COVID shots have had any positive effect. If most of the deaths and adverse reactions happen within the first 14 days after getting a COVID shot and then those people are categorized as ‘unvaccinated’ then the truth has been completely obfuscated.
More support for Sars-CoV-2 spreading earlier than we expected. From the reputable source, Akershus University Hospital, Oslo, Norway: «Researchers at Ahus has found antibodies against Covid-19 in pregnant women in Ahus’s vincinity going back to December 2019 – a month earlier than the first identified case of Covid-19 in Europe.» «There is no systematized information about who the women who got Covid-19 are, and whether they had symptoms, yet it was possible to see that the women with detected antibodies before March 2020 were born in Norway, Eastern-Europe, Africa or the Middle-East.» Translated by me from original source: https://www.ahus.no/nyheter/koronaviruset-kan-ha-vert-i-norge-allerede-i-2019 Link… Read more »
Covid was in Pensacola May 2019 Mothers day. BIL was required to mask for airborne virus at CVS minute clinic. He had bad asthma. They made him mask BC multiple patients from one airplane from Houston were and had sought treatments for fever dry cough and difficult breathing. Short breath… they knew it was airborne transmission on the plane.
I have skim read this, so forgive me if it’s been covered, but how do we explain milder versions circulating from early ‘18 and then becoming more severe? I thought viruses always tended to less severe with time? And how did omicron ‘hang about’ for such a long time before coming to the fore?
Yes, there was a segment speaking to this in section 7a. Additionally, a December 2021 study showed that both Europe’s and the variant Omicron’s mutational history pre-dated the mutational history of the original Wuhan strain (A.x and B.x).23 Four mutations in the DG614G group all existed in Omicron, but not in the original Asian strains from December 2019. This is prohibitive as an argument, both in terms of the time it would take for these four mutations to occur (see below), and the precedent it served in replacing the alleles of the original A.x and B.x variants out of Asia.… Read more »
This may be a bit late for another comment, but this is new (to me) information and it pertains to the fecal spread of COVID. This July 1, 2021 scholarly article appears to show SARS-CoV-2 behaving as a bacteriophage virus, infecting human gut microbiome bacteria and multiplying in feces over an extended period of time, continuing on in culture medium, and being reduced to zero by 4 particular antibiotics, but not by others.
https://www.ncbi.nlm.nih.gov/labs/pmc/articles/PMC8283343/
This reminded my of your argument for fecal-aerosol transmission in the spreading of the pandemic in agricultural regions spraying raw sewage.
I use android. There doesn’t seem to be a way to link or share this article. There is no internet menu because it is not a chrome or ddgo page and there seems to be no link or share buttons. Any ideas?
Right below the signature and the MLA recitation block, and before the citations, are the share buttons.
This is excellent. Thank you! The beauty of this proposition is that it easily explains far too much that I’ve had to “set aside” or “hand-wave” into semi-reasonable places. This includes not only pre-December-2019 facts that didn’t jibe, but all the post-2019 problems (like omicron) that bunch up on the various supposed release dates near the end of 2019. BTW, thanks for informing us about your bout with omicron. I had delta around Thanksgiving 2021, and (almost certainly) Wuhan in January 2020. I am preparing for omicron, just in case. Your take on omicron’s lineage is a great explainer of… Read more »
Elevator pitch “When one examines the complete 144-slot genetic profile of the SARS-CoV-2 Omicron variant, it becomes clear that its lineage is a full two years older than even the first Covid virus in Wuhan, China. Not only did this ancestor of Omicron cause an outbreak across the world in 2018 and 2019, that was mistaken as an 8-fold higher rate of flu across the Asia-Pacific-Africa for those years, but its genetics reveal a robust history of lab mouse serial passes and lab-edited alleles. This proving that its 2018 release as a less-deadly immunity-builder prophylactic virus, and the subsequent release… Read more »
Thank you, thank you, thank you!!! :-D
This coincides quite well with my personal experience, and perhaps a cursory look at CDPH data from the time period. https://dontletitgo.substack.com/p/was-some-variant-circulating-in-2018
Amy, a key statement from your article:
Most of the Covid-Delta sufferers from August 2021 in our household are suffering an extraordinary mold allergy season this year, in terms of both severity and length. I suppose this has to do with heightened immunity systems.
I had IgG antibodies in July 2021, but was not ill with a CLI since June 2017. So I am not sure where I got the antibodies.
TES :-)
Mine was not really an article, so much as a compilation :)
The mold in my apartment back then was sampled & confirmed, multiple species and plenty of it. But what happened to me seemed exaggerated.
What IgG or other test might be useful at this point? It’s been nearly 3 years for me. n-antibody tests I’ve done have been negative, which I now understand now could be expected. But I wish I knew that before I decided to get the vaccine in the spring. I probably made matters worse by doing that. No more!
One thought (of many) is why would the virus be a serious problem in Wuhan in the summer of 2019 if it had actually started in 2018? Is it a coincidence that the The WIV is there? Was it re-released or made worse to coincide with the World Military Games that were held there in October 2019? It does seem likely that the powers that be already knew about the virus but why did it become serious again just before the American election and the need to re-set the world’s financial system? Was it brought back to Wuhan in 2019… Read more »
Munchy, I don’t have the answers to all of that. The most parsimonious explanation is that a milder version of the virus was leaked, and the Chinese knew that it had been leaked, and fought it through silence and less drastic measures, hoping that it would just die out. But as this virus does, a new variant appeared in Wuhan in the Apr/May of 2019, and it was much deadlier. Since the Chinese were covering up the fact that they had accidentally released a bioweapon (not a vaccine test virus), they kept it silent and even clamped down on the… Read more »
Thank you for your thoughtful answer. But…If it started outside Wuhan, why was it Wuhan that was inflicted by a more serious strain in the summer of 2019? Nothing to do with the WIV or the Military Games being there? Quite a coincidence. I have heard that athletesarriving for the Games were greeted by largely deserted streets and people wearing masks. Many of them (the athletes) got sick and then of course went home, to countries all over the world.
Yes, I heard this about Wuhan as well. They were hit hard by Covid in June 2019. But as to why there and why later, I don’t yet entirely know. All I know is that China concealed something horrendous – and given the immunity curve, it happened well before 2019. The other shoe should drop here in 2022. However, given that lots of money is flowing – our officials may simply choose to look the other way. China may well buy its way out of killing 7 million non-citizens and making the world a hell-hole, when it is all said… Read more »
OK, thank you. Let’s hope they fall flat on their face when that other shoe drops next year.
“But by October, it was clear that they had to ethically tell the world community that this thing was not going away”
If this were the case, and it may very well be – the World Military Games where some athletes got sick would have been a terrific spreader event. There are articles (not sure if I am allowed to post them here) that months into the pandemic claim there may have been cases as early as early Nov in France. So..
This also seems relevant, and scary: https://harvard2thebighouse.substack.com/p/a-grin-without-a-cat
I read that article and the two golden silkworm articles. He claims covid 19 is a deattenuating LAV, and will eventually revert back to its full virulence. Hope he isn’t right about it. That would be really bad. What I can’t understand is where he came up with this stuff. I think he was in the NSA but went to prison for some bad shizzle. I don’t think he has a background in the sciences.
I have no background in anything close to this discussion; but I am curious, and perhaps you included it and I missed it; could the “mysterious outbreaks” that occurred on the cruise ships back in 2018 have been what is called Covid now?
Thanks for your research .
Mary,
Possible to even likely. Cruise ships provide an idea environment for fecal aerosol viruses to spread. The Diamond Princess comes to mind. Tons of wet food processing and delivery, miles of sewage and grey water pipes running all over the ship. Numerous drains and one-way valves to malfunction. A virus playground. 2018 would have easily been the older variant of Covid, yes.
TES
Thanks for all the work and information in this, fascinating and extremely helpful!
I asked Jonathan Latham to comment. He’s one of the authors of the covid-miner-passage hypothesis: https://www.independentsciencenews.org/commentaries/a-proposed-origin-for-sars-cov-2-and-the-covid-19-pandemic/
He disagrees with two points in the text:
and says “Omicron dates from late spring 2020”.
I don’t know enough about the science to critique either viewpoint…
Thanks Tim, I disagree on Omicron linking to Clade 20B (Feb – Apr 2020). Yes that is where the line is drawn to in the GISAID charts, but that is only a placeholder, with hopes of confirmation, not a conclusion. There is no evolutionary track from 20B to Omicron at all. In fact the difference is 66 substitutions and 27 deletions. See Exhibit 7.10 – it outlays the proximity by 144 nucleotides evaluated for clades/variants. Deletions are very less common in short term RNA virus evolution as compared to silent, synonymous, AA substitution and insertion mutations – so these deletions… Read more »
3/3. Another possible COV19 precursor: US tourist deaths Ex. The Fiji couple. David and Michelle Paul (30’s), from Fort Worth, Texas, fell ill two days into their vacation to Fiji, vac. from May 19 to 27, 2019. Their symptoms were diarrhea, vomiting, numbness, difficulty breathing, shortness of breath, and they both died, with ‘proper’ med / hosp. care. The husband was put on a ventilator. 5 ppl whom they had contact with were also hospitalised with similar symptoms, and 2 security guards and 2 med staff were put into isolation. (Links are to brief MSM, and the details I report are not all… Read more »
2/3. Imho, the EVALI or VAPI, USA ‘vaping illness’ was almost certainly Covid or a precursor. As it was presented it had nothing to do with Covid. August 2019 -> peaked in September 2019 – died out in Jan. 2020 (i.e. was no longer diagnosed when COV19 ‘arose’ and became an ‘official’ diagnosis.) Almost 3K hospitalized cases and 68 (or so, nos. vary) ppl died, USA (a few cases Canada.) There have been various versions of symptoms, etc. Wiki has 2 entries giving some basics. Here CDC: https://www.cdc.gov/tobacco/basic_information/e-cigarettes/severe-lung-disease.html Old ppl in nursing homes had ‘atypical pneumonia’, ‘lung injuries’ and younger ppl had ‘vaping illness’… Read more »
1/3. A very good piece! WHO was right from the start poised to ‘not blame China’, for several reasons. The previous Dir. Gen. before Tedros was Margaret Chan, Chinese, she was hugely influential, ppl are left in place, networks of influence. —— China is a Major donor. ——The WHO cannot ‘blame’ one country, one lab, one type of research, its role is to defuse conflict and oppositions in favor of an ‘internationalist, generalist, scientific’ (that is so-called scientific) consensus, which supposedly ‘does the least harm’ etc. ——The WHO is not an independent body, now counts on pleasing its funders, e.g.… Read more »
Thank you for this exhaustive investigation and documentation. I have just been made aware of this story by sharing of a link by a friend. I am surprised that I remained unaware of your work until now. You mentioned deaths in a retirement center in Virginia in 2019, that you were aware, and referenced some counter-narrative. Was that a reference to the mysterious viral pneumonia deaths near Fort Detrick in June-July 2019, following which Ft. Detrick viral lab was closed for “breach, without harm” until November 2019? I have had suspicion that the virus leaked from Ft. Detrick in Spring… Read more »
John Thank you for the well thought-out response. First, let me say that I am saddened that you were fired for dissenting that the vaccine dangers are worth being injected by a vaccine which does not reduce transmission in the least (and might even enhance it). What you underwent is a human rights crime – of legendary proportion. The vaccine may have had some therapeutic benefits, and our older family members did get it and fared pretty well – but now those benefits are fading away. I have had insiders offer me information on several situations. But the bottom line… Read more »
Thank You, TES. I would have been granted a conscience-exemption, had I requested one, but I did not do so. I decided to “stand naked with the Jews”, as I put it, at the first indication of the creation of an underclass. (This was an unpopular historical reference, but fully warranted.) I saw that as the only moral choice within a system which was taking this tack. We have seen where this tack leads in history. This has been and still is a spiritual “test” for me, for which one need not posit “God”. I do not see the future,… Read more »
Thanks John, When I read about your choice to side with the created underclass, or ‘stand naked with the Jews’, that hits near and dear to my heart. It takes a certain spark and courage to dissent at your risk, but do so on behalf of those who are targeted by the elite. Yes, spiritual tests do not require one to be a theist in order to be beneficial and valid. The universe does not care what we believe about an old bearded anthropomorph. Its demands upon us are esoteric and reside elsewhere – and theist, agnostic, and atheist –… Read more »
Have you seen the new website of Geert Vanden Bossche? https://www.voiceforscienceandsolidarity.org/
I think your communities may have overlapping goals.
Argmax, a well crafted note. I don’t mind disagreement or questions at all. I have never found R(o), R(t), etc. even in relative form, to be of any use in modeling Covid. I think that someone wrote a PhD on the idea, and given the low level of challenge in the expertise vertical (and the fact that some expertise sets were not qualified to comment upon the genetics of pathogens and had to retreat into theoretical models alone), the model was never challenged to produce results. The model presupposes that there is no such thing as seasonality. The pressures which… Read more »
Thanks for this wonderful document, btw an excellent lecture on appropiate use of logic and science in the search of truth. Drawed up ‘Party Rules’ are frightening, real (pitifully) and an ominous treath for the humanity.
Indeed, The Party is creeping into power globally. And their enemy is anyone who competes for that power through competence or strong culture.
TES
Ex 5.2-3 AP: interesting that African health officials are linking Covid avoidance to prior exposure to malaria and other parasitic diseases.
Yeah, I highly doubt they would get this robust an immunity from that. If that were the case, then HCoV’s would give even better immunity than malaria by far… and they don’t.
Grasping at straws. :-)
Exhibit 13.12….was that the period of time when health officials warned of a vaping crisis?
Part of it I believe so Roni, yes.
I’ve been following you since you started posting. Thank you for this! Please make it into a PDF I can download for a “history book” I’m making to pass on to my 4 children.
Sarah,
Thanks for the readership. If you open this article by itself (rather than the home page) by clicking on the title of the article, in Google Chrome, the three dots on the upper right hand side allow you to ‘Print/Save as PDF’. The resulting PDF is 65 pages long, based on their parsing algorithm – but it is a quick way to obtain a PDF of the entire page.
Hope that helps
TES :-)
this is a lot of information. Thank you for gathering all of this and sharing
The world needs to hold China accountable. This includes holding those American colluders accountable too. Daszak & Fauci.
Xi, agreed. Some of this was not unilateral as research initiative. But we need the genomes from China, by project – or they will retain culpability.
TES